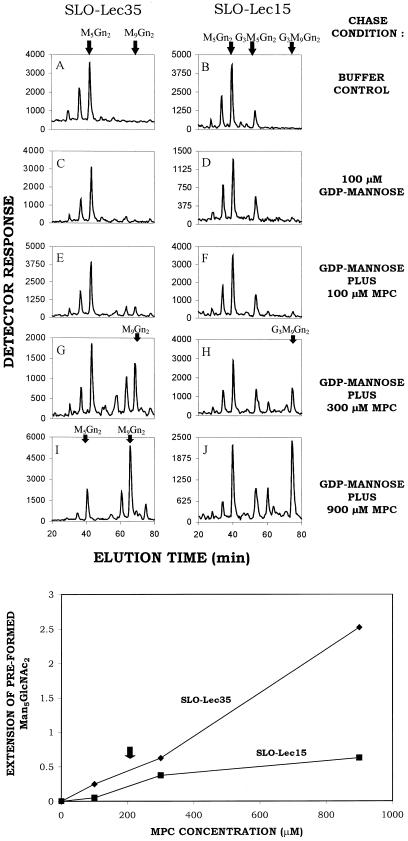
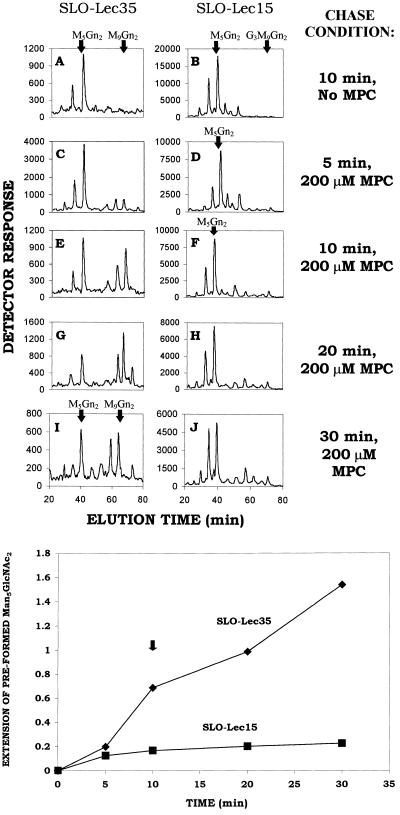
Figure 8.
Mannose-P-citronellol is an efficient mannose donor in SLO-treated Lec35 cells. (Upper left) Lec35.1 (A, C, E, G, and I) and Lec15.2 (B, D, F, H, and J) cells were labeled with [3H]mannose. They were treated with SLO, and then incubated for 10 min with transport buffer (A and B), or buffer plus 100 μM unlabeled GDP-mannose (to convert any [3H]Man1-4GlcNAc2-P-P-dolichol to [3H]Man5GlcNAc2-P-P-dolichol) and either 0 μM (C and D), 100 μM (E and F), 300 μM (G and H), or 900 μM (I and J) unlabeled MPC. LLO were recovered and analyzed by HPLC. Note that Man9GlcNAc2-P-P-dolichol is glucosylated by endogenous GPD more effectively in SLO-Lec15 cells than SLO-Lec35 cells, as expected. (Lower left) HPLC data from the upper left figure were processed (see MATERIALS AND METHODS) to give a normalized, quantitative value for the amount of MPC-dependent mannosylation that occurred at each concentration. The maximum possible value is 4.0. The downward arrow indicates the MPC concentration used in the upper right figure. It is not known why MPC-treated SLO-Lec35 cells had higher values than SLO-Lec15 cells. (Upper right) Lec35.1 (A, C, E, G, and I) and Lec15.2 (B, D, F, H, and J) cells were labeled with [3H]mannose and treated with SLO in a manner comparable to that shown in the upper left figure. The cells were then incubated in buffer alone for 10 min (A and B), or buffer with unlabeled 100 μM GDP-mannose and 200 μM MPC for either 5 min (C and D), 10 min (E and F), 20 min (G and H), or 30 min (I and J). LLO were analyzed by HPLC. (Lower right) The data from the upper right figure were processed to gives values for the extent of MPC-dependent mannosylation, as done for the lower left figure. The downward arrow shows the time used for incubations in the upper left figure.


