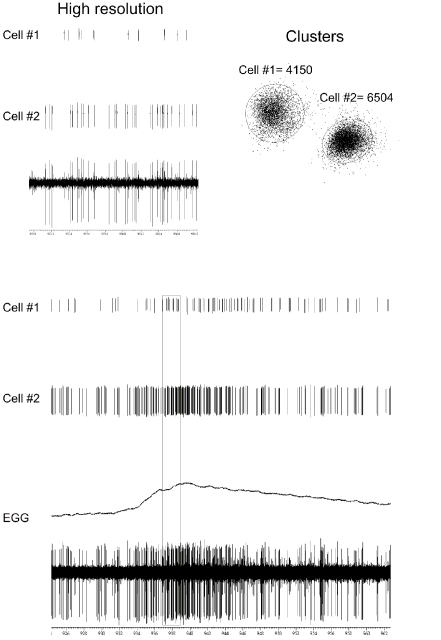
Figure 1.
The bottom two traces show the raw single unit recording from the GG and EGG response before, during, after chemical stimulation (0. 1 M NaCl) of the tongue. The middle two traces show that the raw record can be separated into two single-cell-digitized responses. The top two traces are a high-resolution capture of 2-s of unit responses highlighted by the rectangle in the lower traces. The diagram on the right shows the accuracy by which our waveform analysis software separates spikes into two distinct clusters.

