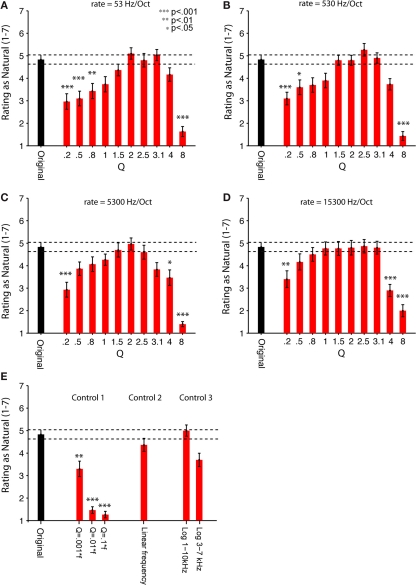
Figure 5.
Human listeners rate the synthetic scale-invariant sounds as natural as the original water recordings. Psychophysical measurements of perception of the natural and synthetic sounds (sample sound files used in the experiments are available as Supplementary Material). Thirty adult human subjects were asked to rate the natural and synthetic sounds on a scale from 1 (most unnatural) to 7 (most natural). (A–E) Original (black bar): Average rating of two natural recordings (brook and stream). (A–D) Experiment 2. Synthetic (red bars): ratings of synthetic sounds, consisted of superposition of chirps, whose frequency was uniformly distributed in log-frequency space. Q varied between 0.2 and 8. (A) Rate 1 = 53. (B) Rate 2 = 530. (C) Rate 3 = 5300. (D) Rate 4 = 15300 Hz/octave. (E) Control experiment 1. Rating of control synthetic sounds, where the cycle decay constant scaled inversely with frequency of each chirp, for Q = 0.1f, 0.01f, 0.001f. Control experiment 2. Rating of control synthetic sounds, where the frequency of the chirps was drawn from a uniform linear distribution (“Linear Frequency”). Control experiment 3: Rating of 2 control synthetic sounds, where the frequency of the chirps was restricted to a subband of frequencies, either 1–10 kHz (“Log 1–10 kHz”) or 3–7 kHz (“Log 3–7 kHz”). Error bars = SEM. To evaluate the contributions of chirp rate and Q to the perception of naturalness, a two-way, repeated measures ANOVA was performed on data in (A–D), revealing the significant main effect of Q [F(9, 21) = 4.958, p < 0.0001]. There was no significant effect of rate, or interactions between the rate and Q parameters. Stars indicate significance of the pair-wise comparisons between rating of each synthetic sound and the original sound, multiple comparisons (n = 47) corrected using one-sided (less than control) Dunnett's adjustment (***p < 0.001; **p < 0.01; *p < 0.05). See “Table S2 in Supplementary Material” for a table of significant p-values.

