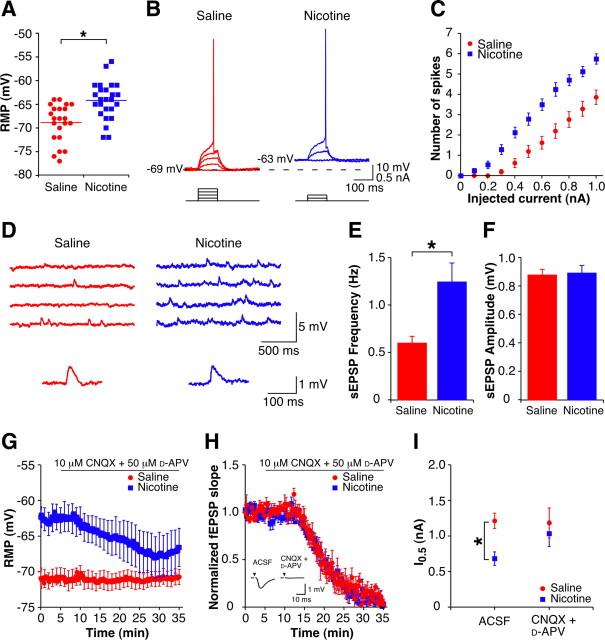
Figure 2.
Enhanced excitability at 1 d withdrawal is dependent on an increase in glutamatergic synaptic transmission. A, Mean and individual resting membrane potentials of CA1 pyramidal cells from 1 d withdrawn animals (sal-cells, n = 22; nic-cells, n = 25). B, Examples of subthreshold depolarizations and action potentials evoked by depolarizing current pulses (0.1 nA steps, 100 ms) up to threshold from CA1 pyramidal cells from a 1 d withdrawn saline-treated animal (red, 0.4 nA at threshold) and a 1 d withdrawn nicotine-treated animal (blue, 0.2 nA at threshold). Capacitance artifacts have been removed for clarity. C, Mean current–spike response curves for 100 ms depolarizing current pulses (sal-cells, n = 21; nic-cells, n = 24). D, Top, Examples of spontaneous EPSPs recorded in current-clamp from CA1 pyramidal cells from 1 d withdrawn animals. Bottom, Example sEPSPs (average of 5 events) presented on an expanded scale (sal-cell, red; nic-cell, blue). E, F, Mean spontaneous EPSP frequency (E) and amplitude (F) in CA1 pyramidal cells from 1 d withdrawn animals (sal-cells, n = 14; nic-cells, n = 14). G, Time course of the resting membrane potential during CNQX + d-APV wash-in (sal-cells, n = 5; nic-cells, n = 5). Error bars are only shown once per minute for clarity. H, Time course of the normalized fEPSP slope during CNQX + d-APV wash-in (sal-slices, n = 5; nic-slices, n = 4). Inset, Example fEPSPs in the presence of ACSF and after 30 min wash-in of CNQX + d-APV. Stimulus artifacts have been removed for clarity, and black triangles represent time of stimulus. I, Mean current required for a firing probability of 0.5 (I0.5) for CA1 pyramidal cells in ACSF (sal-cells, n = 15; nic-cells, n = 13) and CNQX + d-APV (sal-cells, n = 5; nic-cells, n = 4). Data are presented as mean ± SEM. *p < 0.05.

