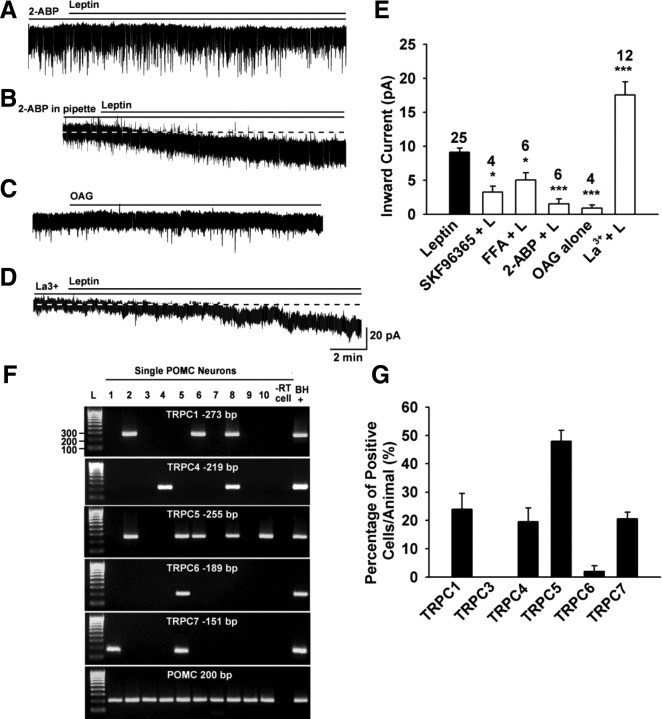
Figure 3.
TRPC channels are expressed in POMC neurons and activated by leptin. A–D, Representative traces of the leptin-induced currents in the presence or absence of the TRPC channel blocker 2-ABP (100 μm) (A), or 2-ABP (100 μm) in the patch pipette (B) or OAG alone (100 μm) (C) or La3+ (100 μm) (D). E, Summary of the effects of TRPC channel blocker SKF96365 (100 μm), FFA (100 μm), 2-ABP, and La3+ on the leptin-induced inward currents and the effect of OAG on the baseline current. La 3+ (100 μm) augmented the current. Blockers were applied 15 min before the application of leptin (100 nm). Vhold = −60 mV. ***p < 0.001; *p < 0.05, significantly different from the leptin control group. Cell numbers tested are indicated. F, G, TRPC channel transcripts were measured in POMC neurons by scRT-PCR. F, Representative gel images illustrating the mRNA expression of TRPC channel subunits in hypothalamic EGFP-POMC neurons harvested from intact male mice. Ninety-five percent of the harvested EGFP-POMC neurons contained transcripts for POMC. The expected size of PCR products for each TRPC channel subunit is indicated. L is the 100 bp DNA ladder. Negative (−RT) control cell was amplified from a harvested POMC neuron without RT. Positive (BH+) control was amplified using cDNA from mouse basal hypothalamic tissue. G, Bar graph represents the mean ± SEM of the percentage of POMC neurons expressing each TRPC subunit mRNA in 70 cells from five mice. An average of 14 cells were analyzed from each animal.

