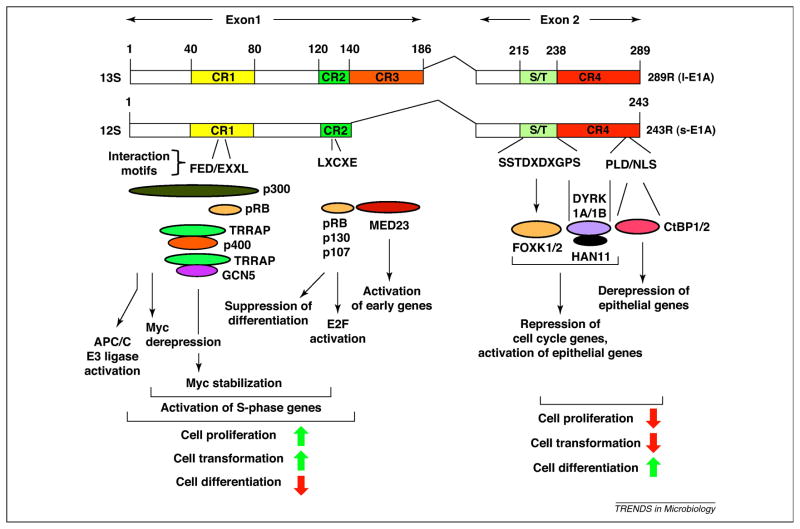
Figure 2. Schematic illustration of interaction of cellular proteins with HAdv5 E1A proteins.
The functional consequences of such protein interactions are also indicated. The N-terminal region of E1A exhibits a dominant oncogenic activity while the C-terminal region contributes suppression of oncogenesis. The green upward arrows indicate activation of various cellular processes and the red downward arrows indicate suppression of such processes.

