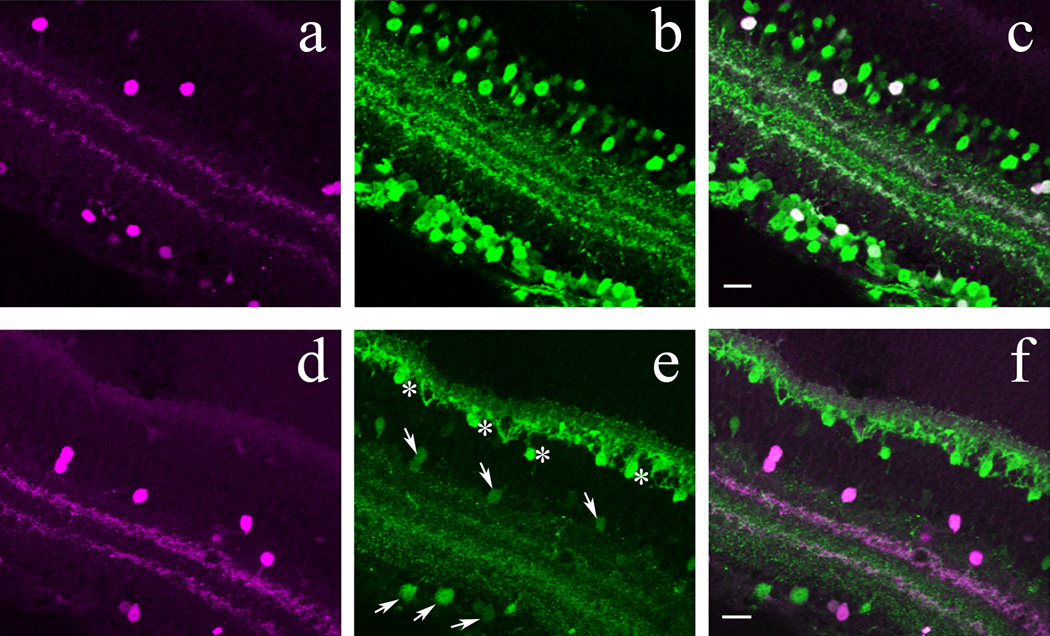
Figure 3.
Calcium-binding proteins in POMC-DsRed+ cells in confocal images of vertical cryostat sections. A, D: POMC-DsRed (magenta) retina showing soma distribution in both the INL and GCL with two bands in the IPL. B: Confocal image illustrating the same region as in A, showing numerous calretinin+ (green) somas in the INL and GCL and three distinct bands within the IPL. C: A merged image of A and B showing colocalization of POMC-DsRed+ and calretinin+ somas, as well as colocalization of POMC-DsRed+ bands with the inner and outer calretinin+ IPL bands. E: Confocal image of the same region as in D, showing calbindin+ (green) somas in two distinct regions of the INL with somas also in the GCL and in three distinct bands in the IPL. The calbindin+ (putative horizontal cell) somas (asterisks) at the outer border of the INL and their projections seen in the OPL were more brightly stained than were somas and processes located in the inner retina (arrows). F: A merged image of D and E showing colocalization of POMC-DsRed+ somas and bands with calbindin+ somas and inner and outer IPL bands. Note, all POMC-DsRed+ somas and bands colocalize with calretinin and calbindin. Scale bar: 20µm.

