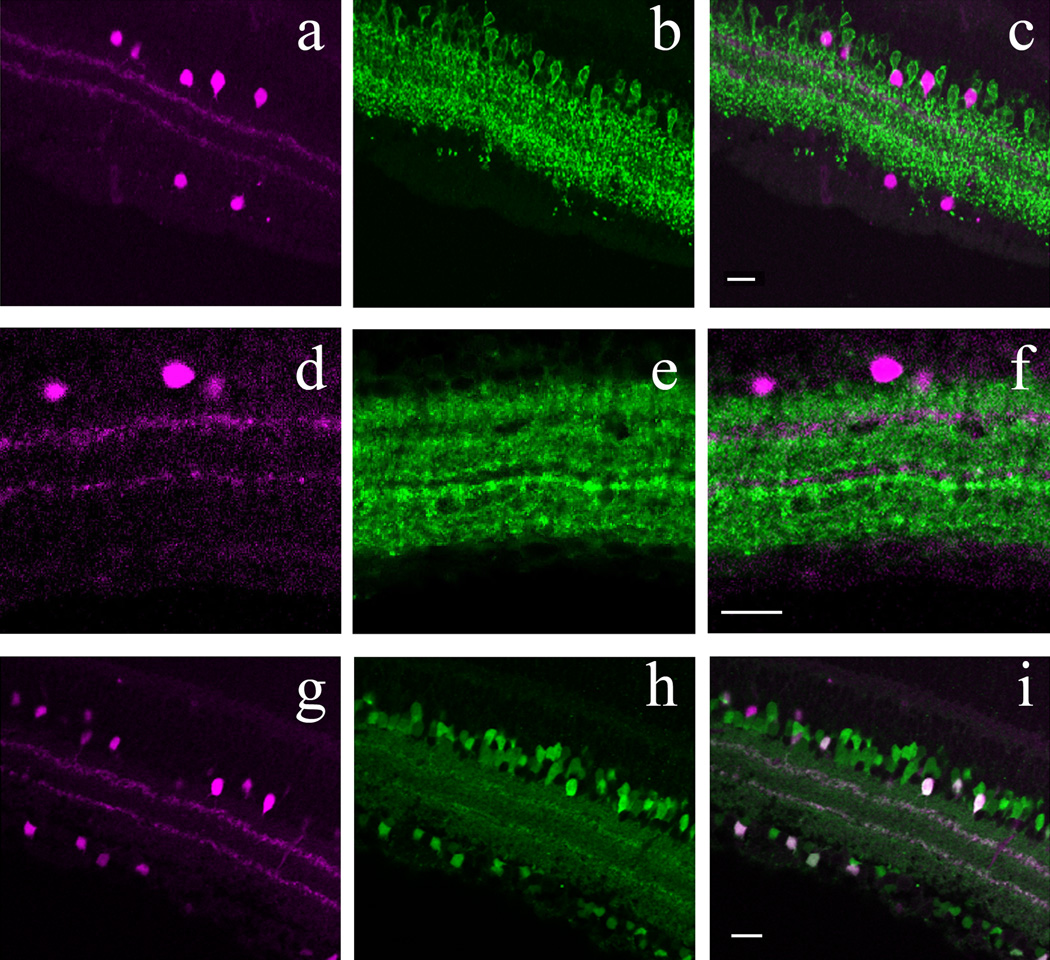
Figure 4.
Inhibitory amacrine cell marker detection in POMC-DsRed cells in confocal images of vertical cryostat sections. A, D: POMC-DsRed (magenta) retina showing soma distribution in both the INL and GCL with two bands in the IPL. B: Image representative of the same region as A, showing GLYT-1 immunolabeling (green) for numerous cell bodies in the INL with projections throughout the IPL. Note the absence of GLYT-1-ir somas in the GCL. C: A merged image of A and B, showing no colocalization of POMC-DsRed+ cell bodies with GLYT-1 immunolabeling. Additionally, although GLYT-1+ projections are broadly distributed within the IPL, they do not colocalize with the two DsRed+ bands. E: Image displaying the same region as in D, showing faint GAD65+ somas (green) in the INL and GCL with widespread projections throughout most of the IPL. Note the two distinct bands characterized by an absence of GAD65+ projections in the IPL. F: A merged image of D and E showing no colocalization of GAD65-ir cell bodies or their projections with the two POMC-DsRed+ bands, which distribute within horizontal spaces in the IPL devoid of GAD65-ir. G: DsRed+ somas (magenta) and projections of a POMC-DsRed / GAD67-EGFP double transgenic mouse. H: Image illustrating the same region as in G, showing GAD67-EGFP+ somas in both the INL and the GCL and two bands within the IPL from their projections. I: A merged image of G and H showing strong colocalization of POMC-DsRed+ cell bodies in both the INL and GCL with GAD67-EGFP+ somas. Furthermore, colocalization of these markers in two IPL bands is also seen. Scale bars: 20µm.

