
Table 2.
Pharmacological characterization of morphinan monovalent and bivalent ligands at the kappa opioid receptor using the [35S]GTPγS binding assay
| Compound | Structure | Kappa (AgonMCL-692, MCL-693, ist) | Kappa (Antagonist) | ||
|---|---|---|---|---|---|
| EC50 (nM) | Emax (% maximal stimulation over basal) | IC50 (nM) | Imax (% maximal inhibition) | ||
| MCL-691 8 |
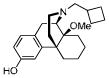
|
2.8 ± 0.90 | 90 ± 3.6 | 22 ± 3.7 | 37 ± 3.0 |
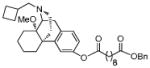
| MCL-692 9b |
|
2.4 ± 0.57 | 83 ± 0.95 | 17 ± 2.9 | 43 ± 4.3 |
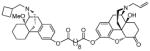
| MCL-693 13b |
|
2.1 ± 0.076 | 90 ± 6.2 | 6.4 ± 2.7 | 30 ± 4.7 |
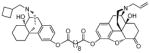
| MCL-694 15c |
|
18 ± 4.5 | 80 ± 4.8 | 7.7 ± 3.3 | 33 ± 3.8 |
| MCL-695 15b |
|
0.84 ± 0.089 | 100 ± 0.95 | 3.7 ± 1.2 | 23 ± 2.9 |
| MCL-696 15a |
|
12 ± 4.9 | 74 ± 16 | 49 ± 13 | 35 ± 2.2 |
| MCL-715 11 |
|
5.5 ± 0.31 | 130 ± 3.3 | NIa | NIa |
| MCL-714 12 |
|
7.3 ± 0.81 | 130 ± 12 | NIa | NIa |
Membranes from CHO cells that expressed the human κ opioid receptor were incubated with 12 concentrations of the compound in the presence of 0.08 nM [35S]GTPγS for 60 min at 30°C. Nonspecific binding was measured by the inclusion of 10 μM GTPγS. For the inhibition experiments, [35S]GTPγS binding was stimulated by the addition of 100 nM U50,488. Data are the mean ± SEM from three experiments performed in triplicate.
a
NI = No Inhibition