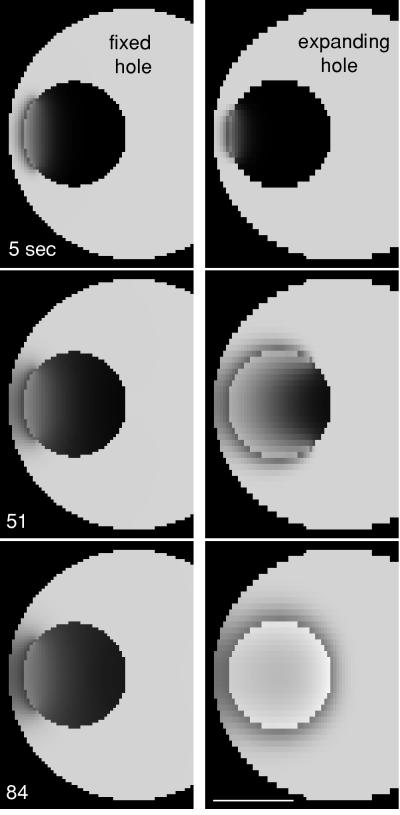
Figure 5.
Simulation of 70-kDa entry at the time of GVBD. Left, simulation of entry through a hole with a fixed diameter of 45 μm. Right, simulation of entry through a hole that opens at a constant rate and is complete at 35 s. Timing of the images relative to the beginning of the opening in the simulation are shown. The simulations were done in three dimensions, and the equatorial plane is shown. The simulation with the expanding hole fits the experimental data (Figure 2) much better than the simulation with the fixed hole. See movies “fixed.mov” and “spreading.mov” at the Molecular Biology of the Cell web site. Bar, 50 μm.

