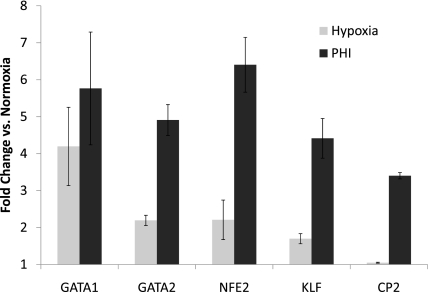
Figure 4.
RNA levels of many transcription factors associated with globin gene expression increase in MLE cells exposed to hypoxia. Real-time qPCR was used to measure steady-state concentrations of mRNAs extracted from MLE cells exposed to different experimental conditions: control (normoxia), 20-hour exposure to 1.5% O2 (Hypoxia), or 20-hour exposure to the prolyl-4-hydroxylase inhibitor (PHI) L-mim. Fold-change in specific mRNA concentrations, compared with those in control cells, is depicted (0 = no change from concentrations in control cells). Levels of initial cDNA templates between samples were normalized by comparison with β-actin amplification. Target genes and primers used are as shown in Table 1. GATA1 and GATA2, globin associated transcription factor isoforms 1 and 2, respectively; NFE2, nuclear factor (erythroid-derived 2, p45); KLF, Kruppel-like factor 1 (erythroid); CP2, alpha-globin transcription factor CP2. Data are presented as mean ± SEM; n = 3.

