Figure 1.
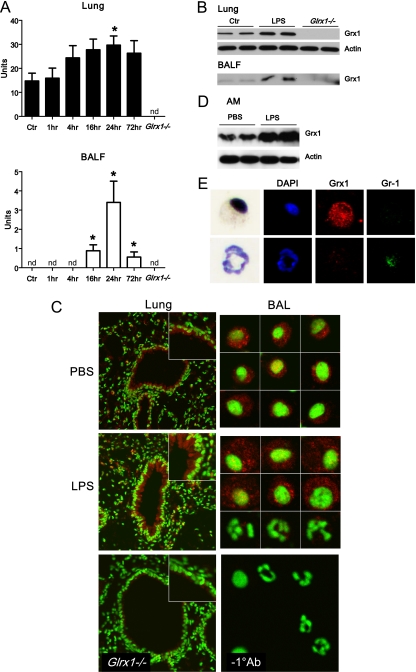
Assessment of Grx1 activity and expression after oropharyngeal aspiration of LPS. (A) Whole-lung homogenates or cell-free BAL fluid (BALF) were collected from wild-type (WT) C57B/6 mice after PBS (Ctr) or LPS aspiration (5 μg). At the time points indicated, Grx1 activity was evaluated. As negative controls, lung homogenates and cell-free BALF from Glrx1−/− mice were included. Data are expressed as mean units of four mice per group (± SEM). *P < 0.05. nd, = not detected. (B) Protein was extracted from whole-lung homogenates or cell-free BALF of WT C57B/6 mice after PBS (Ctr) or LPS aspiration at 24 hours, and analyzed for Grx1 by immunoblot. As negative controls, lung homogenates and cell-free BALF from Glrx1−/− mice were included. Average mean (± SEM) densitometric values for Grx1 on two independent pooled experiments (n = 4 mice/group) include, for lung tissue, Ctr, 4.7 (1.5); LPS, 9.3 (0.0);* and Glrx1−/−, 0.0 (0.0); and for BALF, Ctr, 3.6 (0.4); LPS, 7.2 (2.0);* and Glrx1−/−, 0.0 (0.0). *P < 0.05 (ANOVA), compared with the PBS group. (C) In situ evaluation of Grx1 content in lung tissue (left) from WT mice exposed to PBS (Ctr) or LPS for 24 hours. As a control, Grx1 staining was performed, using a lung isolated from a Glrx1−/− mouse. Results were evaluated by confocal laser scanning microscopy. Original magnification, ×200. Insets: Twofold enlargement of bronchial epithelium. Grx1, red; DNA, green. Right: Assessment of Grx1 immunoreactivity in cells recovered from BALF. WT mice were exposed to PBS or LPS, and were lavaged 24 hours later. Cytospins were prepared for the evaluation of Grx1 content via confocal laser scanning microscopy. Individual cells are shown. Right middle: Top two rows of cells represent cells with morphology consistent with alveolar macrophages (Ams), whereas bottom row represents cells with morphology consistent with neutrophils. Images are representative of more than 50 cells evaluated per group. Mean relative fluorescence intensity (RFI) values (SEM; n = 25) for Grx1 content in macrophages include 0.9 (0.1) for PBS, and 1.4 (0.3)* for LPS. Right bottom: As a control, the primary antibody was omitted from the staining protocol. Original magnification, ×400. Grx1, red; DNA, green. *P < 0.05 (ANOVA), compared with PBS group. (D) Assessment of Grx1 content in AMs isolated from BALF 24 hours after instillation of LPS or PBS. Macrophages were isolated via Percoll gradient centrifugation, and Grx1 content was assessed via Western blot analysis. (E) Evaluation of Grx1 and Gr-1 expression in BAL cells. Twenty-four hours after instillation with LPS, BAL was performed, and cells were stained with anti-Grx1 and Gr-1 antibodies. Expression of Grx1 (red) and Gr-1 (green) was examined via confocal laser scanning microscopy. Nuclei were counterstained with 4′,6-diamidino-2-phenylindole (DAPI) (blue). After confocal analysis, coverslips were removed and cells were stained using a Hema3 kit. Note the strong immunoreactivity of Grx1 in AMs, which do not react with Gr-1 antibody, whereas neutrophils that react with anti-Gr-1 show low levels of Grx1.

