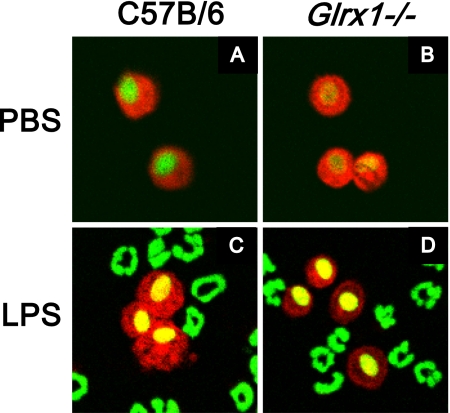
Figure 5.
Assessment of S-glutathionylation (PSSG) in BAL cells. C57B/6 WT mice and Glrx1−/− mice were exposed to PBS, or LPS via oropharyngeal aspiration, for 16 hours. Mice were lavaged, and 5 × 10⁴ BAL cells were centrifuged onto glass microscope slides before being stained for S-glutathionylated proteins (red), using Grx1-catalyzed cysteine derivatization. Nuclei were counterstained with Sytox Green (green), and images were captured using laser scanning confocal microscopy. Images are representative results of four animals/group. Original magnification, ×200. Mean (SEM, n = 25) RFI values for PSSG content in AMs include, for C57Bl\6 mice, PBS, 1.4 (0.1); for Glrx1−/− mice, PBS, 1.4 (0.1); for C57Bl\6 mice, LPS, 1.5 (0.1); for Glrx1−/− mice, LPS, 1.2 (0.1). No statistically significant differences were apparent between different treatment groups.

