Figure 6.
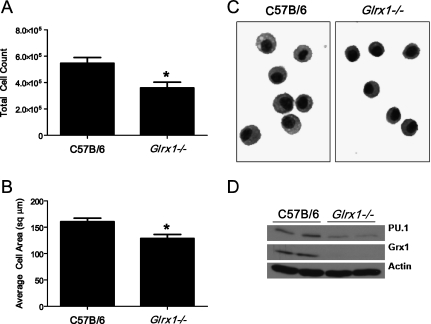
Evaluation of AMs from WT or Glrx1−/− mice. (A) Control C57B/6 WT or Glrx1−/− mice were lavaged, and total cells recovered were enumerated. Data represent mean values (± SEM) of total cells recovered from 15 mice/group. *P < 0.05 (ANOVA). (B) Recovered BAL cells were centrifuged onto glass microscope slides and stained, and their two-dimensional areas were calculated using digital image analysis software. Data represent mean area (± SEM) of 300 cells from three mice/group. *P < 0.05 (ANOVA). (C) Representative micrograph of cells highlights morphologic differences between AMs derived from WT C57B/6 and Glrx1−/− mice. Original magnification, ×200. (D) Immunoblot analysis of AMs for the E-twenty-six transcription factor and marker of macrophage maturity PU.1, Grx1, and actin as genotype and loading controls, respectively. BAL cells were derived from control mice and consisted of > 99% AMs. Data are representative of blots obtained from three independent experiments. Average mean (± SEM) densitometric values for PU.1 (n = 4, two pooled experiments) include, for C57B/6 mice, 3.0 (1.6); for Glrx1−/− mice, 1.0 (0.3).* Average mean (± SD) densitometric values for Grx1 (n = 4, two pooled experiments) include, for C57B/6 mice, 2.9 (0.1); for Glrx1−/− mice, 0.0 (0.4). *P < 0.05 (ANOVA), compared with C57Bl\6 group.

