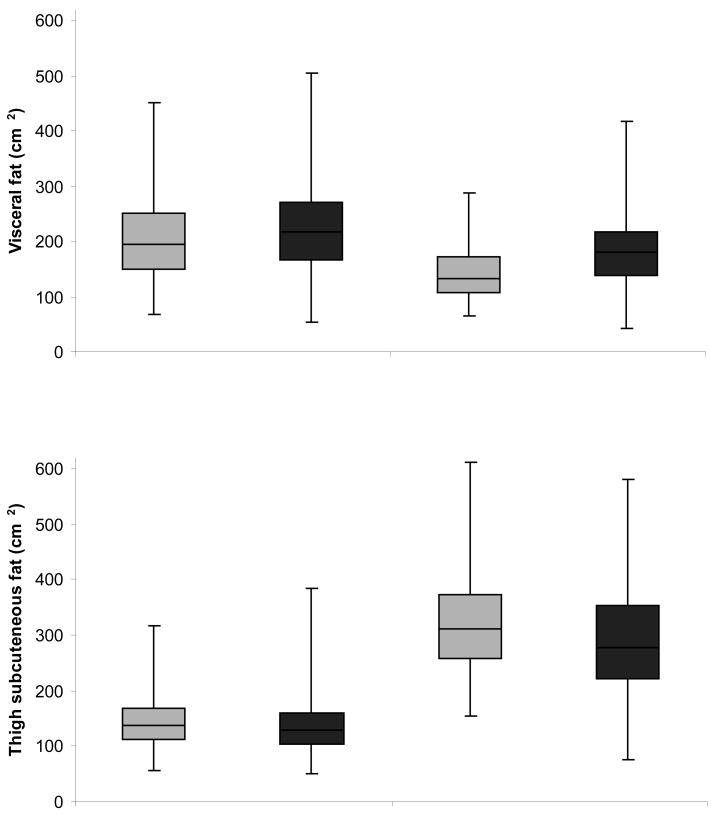
Figure 1.
Box plots a of visceral and thigh subcutaneous fat according in obese men and women with and without metabolic syndrome
a Dark line in the middle of the box is the median; bottom and top of the box represent the 25th and 75th percentile; end of the whiskers represent the minimum and maximum

