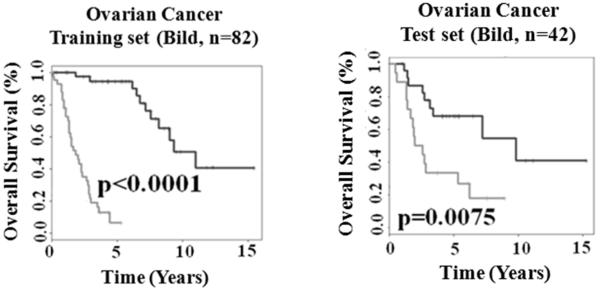
Figure 1.
The 28-gene prognostic signature predicts overall survival in ovarian cancer. Kaplan-Meier analyses of the training cohort (A) and test cohort from Bild et al. (5). The upper curves represent the gene expression-define low risk group, and the lower curve represent the high risk group. The median of the risk scores with a value of 0.301 generated by fitting the Cox proportional hazard model on the training set was taken as the cut-off in both training and test sets.

