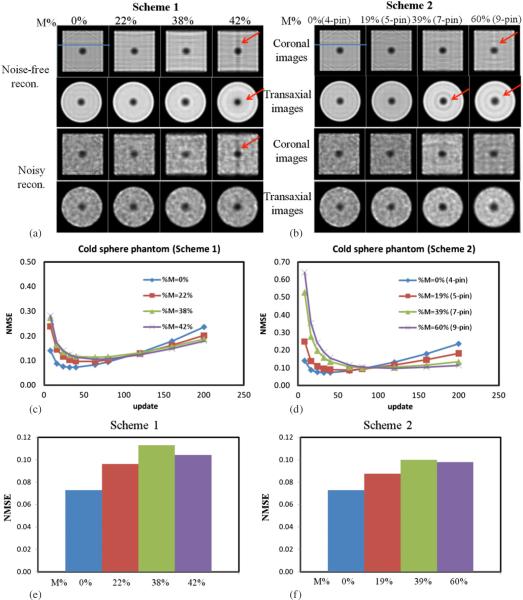
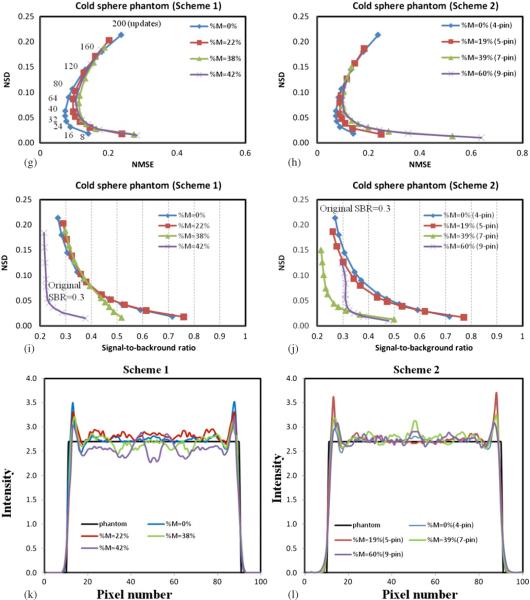
Figure 8.
Samples of noise-free and noisy reconstruction images (coronal and transaxial, 120 updates) for the cold sphere phantom for different degrees of multiplexing obtained from (a) scheme 1 (same pinhole numbers) and (b) scheme 2 (increasing pinhole numbers). Apparent artifacts are observed for both schemes (arrows). The NMSE shown as a function of number of updates for increased degrees of multiplexing for (c) scheme 1 and (d) scheme 2. (e) and (f) The lowest NMSE achieved for different degrees of multiplexing for the two schemes. (g) and (h) Corresponding NMSE-to-noise trade-off curves for different degrees of multiplexing for both schemes. (i) and (j) The SBR-to-noise trade-off for both schemes. (k) and (l) Image profiles drawn along uniform region shown in (a) (blue line).


