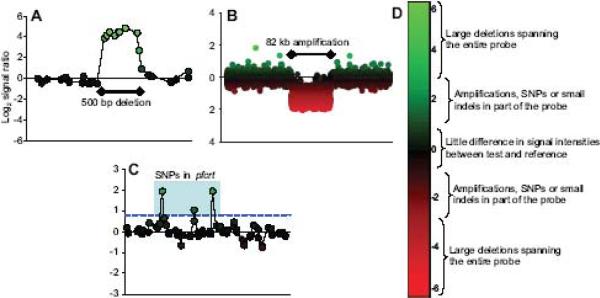
Figure 2. Feature detection by CGH microarrays.
Hybridization signals on CGH microarrays identify various polymorphisms. Each data point is a microarray probe and its log2 signal ratio (y-axis) is plotted by genome position (x-axis). (A) A 500 bp segment is deleted in HB3 and corresponds to a set of probes exhibiting a very strong hybridization bias towards 3D7. (B) An 82 kb amplification is detected in Dd2 showing a moderate hybridization bias towards Dd2. (C) SNPs in Dd2 pfcrt are detected by individual probes exhibiting a hybridization bias towards 3D7 (light blue box). A blue dashed line indicates the 0.8 cutoff used to indicate the presence of SFPs. (D) Signal ratio ranges are associated with different types of polymorphisms.

