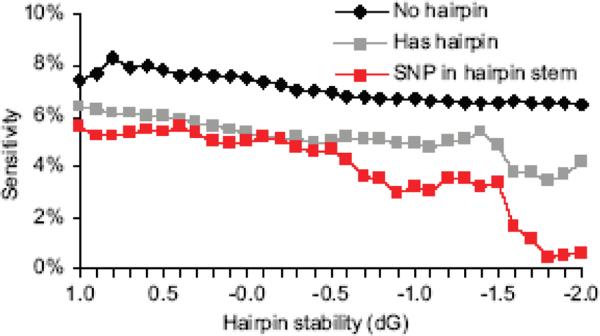
Figure 6. Hairpin structures reduce SNP sensitivity.
All probe sequences were examined for potential to form secondary structures. In some cases, multiple structures of varying stability are predicted for a single sequence. The change in free energy (dG) indicates relative hairpin stability. Probes were classified as containing a hairpin, or containing no hairpins across a range of free energy cutoffs. The probes that span a SNP in the hairpin stem give the lowest sensitivity at all free energies.

