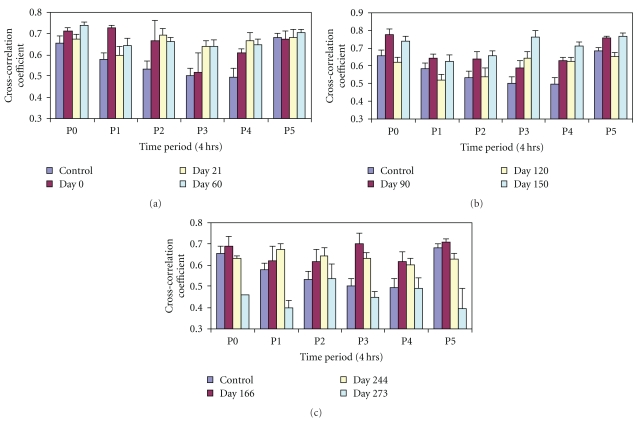
Figure 4.
Graph showing circadian variations of cross-correlation coefficients (Xcorr) of blood pressure and heart rate in six periods P0–P5 at (a) 0–60 days (b) 90–150 (c) 166–273 days of diabetic conversion. The prediabetic control values were taken from n14 to n1 days. Values are mean ± SEM. *P < .05.

