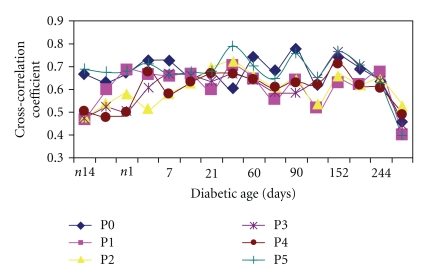
Figure 5.
Graph showing longitudinal effect of diabetic age on cross-correlation coefficient of BP and HR in the 6 diurnal periods over the 9-month period. Values are means ± SD. (n = 8). Note the wide differences before onset of diabetes and the fall and convergence towards the last stage (273 days).

