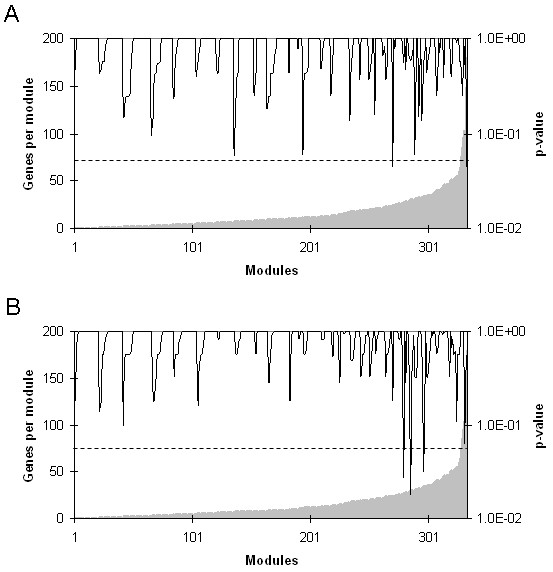
Figure 1.

Number of genes represented in each functional module and p- values for the repressed modules hypothesis. HNSCC patients were classified according to pathologic lymph node status (positive or negative) or tumor recurrence (recurrent or non-recurrent tumor) after treatment (surgery with neck dissection followed by radiotherapy). Gene expression was assessed by microarray and functional module analysis was performed. Functional modules were defined according to the following databases: Biocarta], GeneDecks, Gene Ontology, and to the Kyoto Encyclopedia of Genes and Genomes Pathway Database (KEGGPD). A module is considered to be induced or repressed when it contains a fraction of induced or repressed genes that is higher than expected. The p-value of this fraction was calculated using hypergeometric distribution and a false discovery rate of 5% was applied to correct multiple testing. A - Negative lymph node (pN0). B - Non-recurrent tumors. These figures are representative of those for positive lymph node (pN+) and for recurrent tumors, as well as for the induced modules hypothesis.
