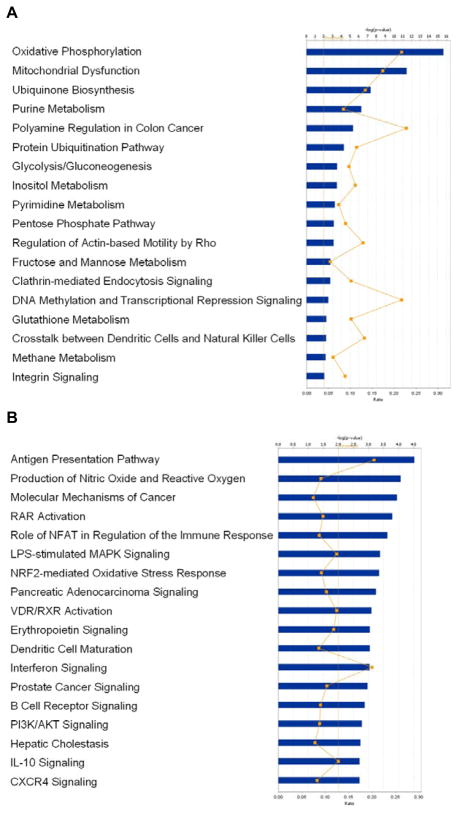
FIGURE 3. Pathway analysis of differentially expressed genes in expanded NK-cell products compared to freshly isolated NK cells.
(A) Ingenuity Pathway Analysis showed canonical pathways significantly modulated by the genes overexpressed in expanded NK cells (P < 0.01). The p value for each pathway is indicated by the bar and is expressed as -1 times the log of the p value. The line represents the ratio of the number of genes differentially expressed in a given pathway divided by the total number of genes that make up that pathway. (B) Ingenuity Pathway Analysis showed canonical pathways significantly modulated by the genes whose expression was reduced in expanded NK cells (P < 0.01). Only the 18 pathways with the most significant changes are shown.

