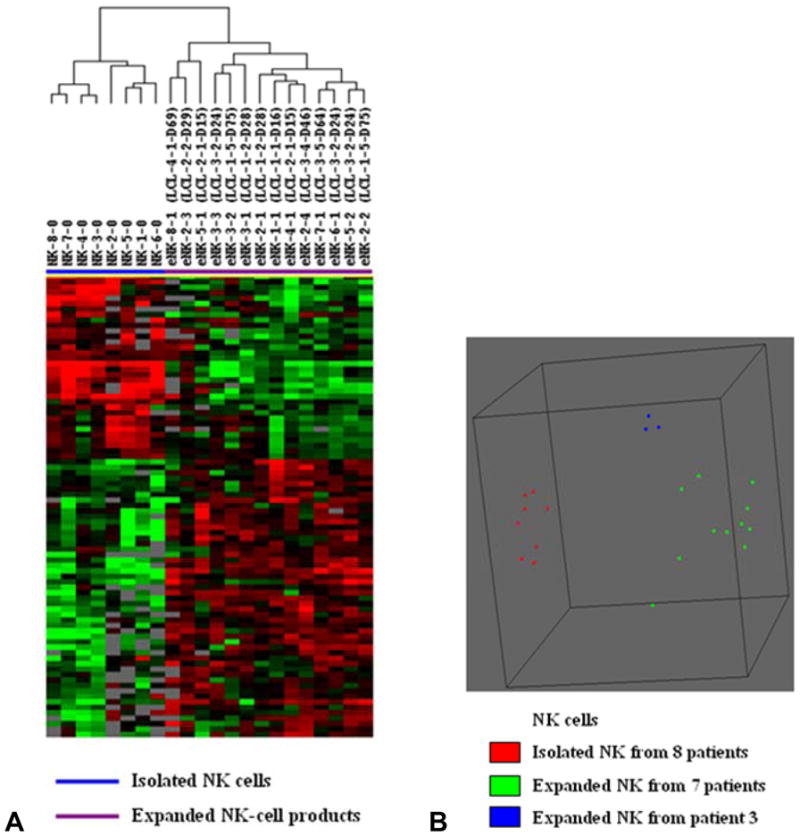
FIGURE 5. MicroRNA expression and multidimensional scaling analysis of NK-cell products.

(A) Supervised hierarchical clustering analysis showed obvious discrimination between the freshly isolated NK cells and the expanded NK-cell products. Sample label NK-8-0 indicates the freshly isolated NK cells from patient 8 and eNK-8-1 means the first expanded NK-cell product from patient number 8. (B) Supervised multidimensional scaling using centered correlation separated NK-cell products into the expanded and the freshly isolated cells. Each spot represents one NK cell sample. All three expanded NK-cell products from patient 3 showed closely related microRNA expression profiles, but the 3 expanded NK cell products from patient 2 and the 2 from patient 5 did not cluster together.
