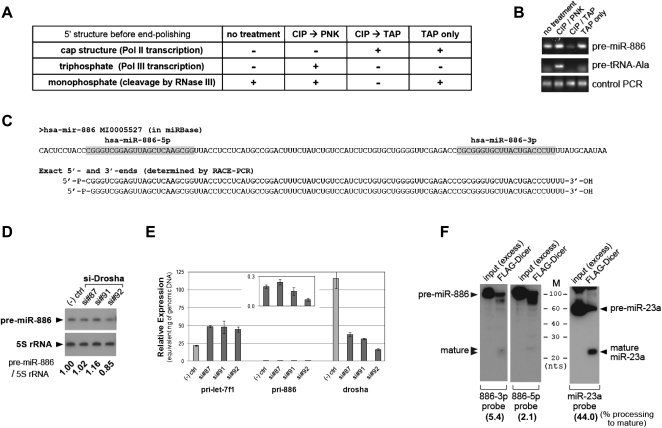
FIGURE 3.
Pre-miR-886 is distinct from a canonical pre-miRNA. (A) Expected 5′-RACE results tabulated for three different 5′-end structures of object RNA after four 5′-end polishing procedures. Before ligation to the 5′-linker oligoribonucleotide (see also Supplemental Fig. S3A for the 5′-RACE scheme), total RNA from CRL2741 (the object RNA) was treated with combinations of PNK (polynucleotide kinase), CIP (calf intestinal phosphatase), or TAP (tobacco acid pyrophosphatase). During 5′-RACE, only 5′-monophosphate of the object RNA can be ligated to the 3′-end of the 5′-linker, and this ligation is a prerequisite for subsequent PCR amplifications. mRNAs have a 5′-cap structure that is a substrate of TAP, which removes a cap and leaves 5′-monophosphate. To be converted to 5′-monophosphate, 5′-triphosphate of Pol III transcripts must first be dephosphorylated by CIP and then treated with PNK, which transfers a monophosphate group to a 5′-OH group (Rezaian 1999). (B) 5′-RACE was performed after the treatments described in panel A. After the second round of PCR, the products were resolved in a 2% agarose gel and visualized by EtBr staining. In comparison to the anticipated results in panel A, it is evident that pre-miR-886 has a 5′-monophosphate. Since the 5′-end of tRNA precursors are known to be triphosphates (Lee et al. 1987), we used the precursor tRNA–Ala (#66 tRNA at chromosome 6 in the tRNA database; http://gtrnadb.ucsc.edu/) as a control, to confirm polishing procedures. As expected from panel A, pre-tRNA–Ala was RACE-amplified only in lane 2 (CIP → PNK). Equal amounts of cDNA among the four samples were confirmed by PCR with two specific primers to pre-miR-886 (bottom panel “Control PCR,” see also Supplemental Fig. S3A). PCR products were cloned and sequenced to determine the precise 5′-end of pre-miR-886 (shown in panel C). (C) miR-886 in the miRbase (top) was aligned to experimentally determined pre-miR-886 sequences (bottom). Our 3′-RACE procedure depended on the 3′-hydroxyl group of object RNA (see Supplemental Fig. S3B and legend for details). Therefore, pre-miR-886 has 5′-monophosphate (5′-P-) and 3′-hydroxyl groups (-3′-OH). The mature miRNAs (in the miRbase) are in gray. Sequencing multiple RACE products revealed two different 5′-ends offset by 1 nt. (D) Northern hybridization after suppression of Drosha. Three siRNAs against Drosha (si#87, #91, #92) and a negative control siRNA were transfected into CRL2741 cells. Transfections were performed twice (at day 0 and 3), before harvesting cells at day 6. Each band was quantified with AlphaView software 2.0.1.1, and the intensity of pre-miR-886 relative to 5S rRNA was calculated (the numbers under each lane). The value of the negative control siRNA was set as 1. (E) qRT-PCR measurement of primary transcripts for let-7f and pre-miR-886 as well as Drosha mRNA. Titrating amounts of genomic DNA from CRL2741 cells were included in qRT-PCR, and Ct (cycle threshold) values from each amount were obtained. A regression line was drawn and used to convert a Ct value from cDNA into a nanogram (ng) amount. The expression levels of each cDNA were thus expressed as “equivalent ng of genomic DNA” (y-axis) and can be directly compared among different primer pairs. To detect primary transcripts for pre-miR-886 (pri-886), we used a reverse primer “miR-886-3p as” (Fig. 1C; Supplemental Table 2) combined with a forward primer (“miR-886-22-1” in Supplemental Table 2) corresponding to a sequence immediately upstream of pre-miR-886. The signal for pri-886 was very low and so was re-plotted against the magnified y-axis in a box within the main graph. (F) In vitro processing of pre-miR-886 (left panels) and pre-miR-23a (right panel) by recombinant Dicer. Cleaved products were detected by Northern hybridization with indicated probes. An excess amount of input was included to ensure the integrity of the synthetic RNA substrates prior to cleavage by Dicer. In each FLAG-Dicer lane, all bands (including the mature miRNA, the unprocessed substrate, and other degradation products) were quantified as described in panel D. Percent processing of mature miRNA (the intensity of mature miRNA relative to that of the sum of all the bands) was calculated and indicated at the bottom of each blot.

