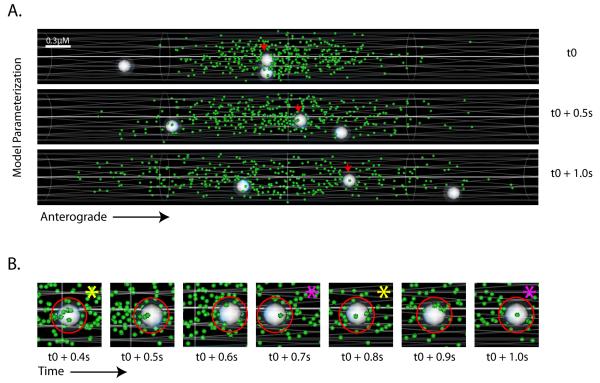
Figure 6. A biophysical simulation model of slow axonal transport.
(A) A simulation model was developed as described in the text, consisting of a hypothetical axon cylinder, synapsin particles (green) distributed in the central zone and vectorial ‘mobile-units’ (white spheres). Scale bar is shown in the upper-left and elapsed time to the right of the frames. Screen-shots from a simulated time-lapse show mobile-units traversing through a pool of synapsin particles; one anterogradely moving particle is marked with small red arrows (also see Supplementary video #7). (B) Dynamics of association/dissociation and clustering of synapsin particles on a mobile unit shown in representative zoomed screen-shots from a simulated time-lapse. The red circle represents the ‘dissociation radii’ around a mobile unit that restricts the movements of the synapsin particles that collide with the mobile-units (see text). Note the stochastic clustering and dispersion of synapsin particles upon the mobile unit in successive frames; marked by yellow and magenta asterisks respectively.

