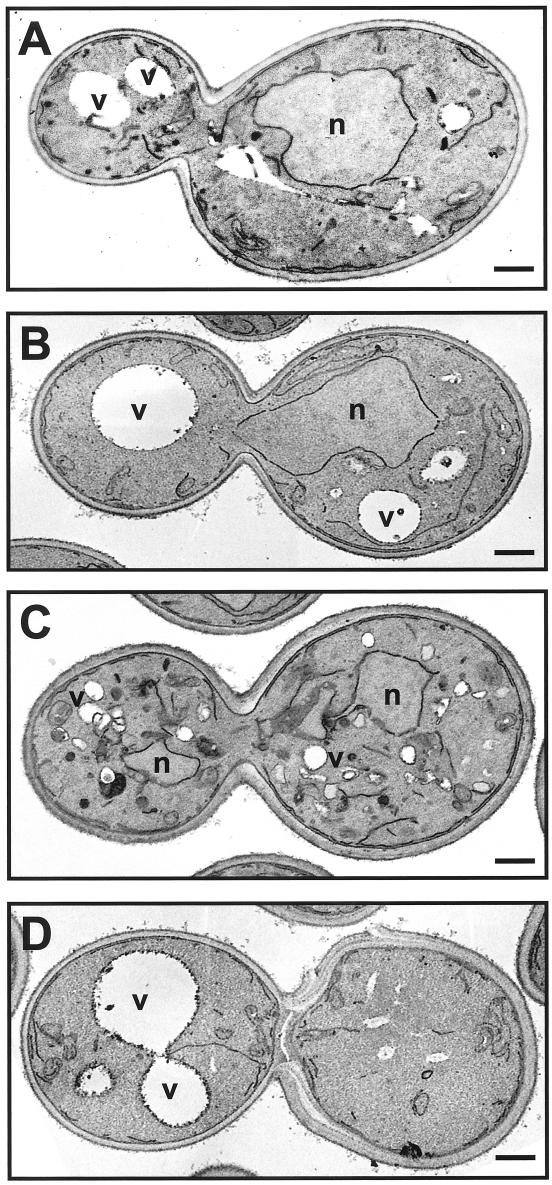
Figure 8.
Electron micrographs of sft1Δ cells containing either the 2 μ SFT1 (SARY160) 2 μ BET1 (SARY181), or 2 μ SNC2 plasmids (SARY208). Yeast strains were grown at 25°C for 4 h and permanganate fixed to accentuate membranes. (A) sft1Δ 2 μ SFT1 (SARY160). Overexpression of Sft1p results in some vacuolar fragmentation as well as the accumulation of some dark membranous structures. (B) sft1Δ 2 μ BET1 (SARY181). Cells are indistinguishable from wild-type (D). (C) sft1Δ 2 μ SNC2 cells (SARY208). Note no significant differences in amount of ER membranes (compare with A, B, and D) but fragmentation of the vacuoles and the appearance of numerous dark membranous structures. (D) Wild-type parental strain (SEY6210, Table 1). The bar in the bottom right-hand side of each micrograph corresponds to 0.5 μm. N, nucleus; V, vacuole. The doubling times for each of the strains at 25°C were pSFT1 sft1Δ (SARY160), 2.0 h; pBET1 sft1Δ (SARY181), 2.3 h; pSNC2 sft1Δ (SARY 208), 6.7 h; and wild-type (SEY6210), 1.9 h (Table 1).

