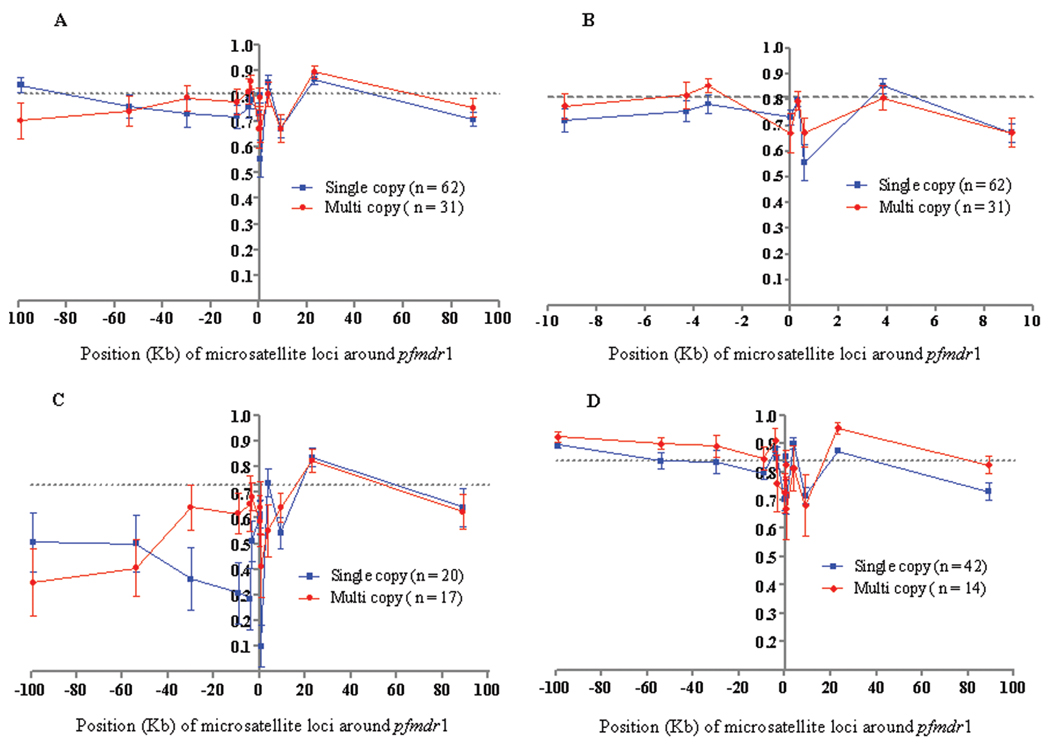
Figure 2.
The expected heterozygosity (He) at 13 microsatellite loci around pfmdr1. Comparison of He between groups of isolates with a single copy or multiple copies of pfmdr1. The mean He at neutral loci on chromosomes 2 and 3 is shown by a dotted line. The error bars indicate ± 1 standard deviation. A, isolates from both western and eastern Cambodia; B, detail showing the closest 8 microsatellite loci flanking (± 9 kb) pfmdr1 for isolates from western and eastern Cambodia; C, isolates from western Cambodia; D, isolates from eastern Cambodia.

