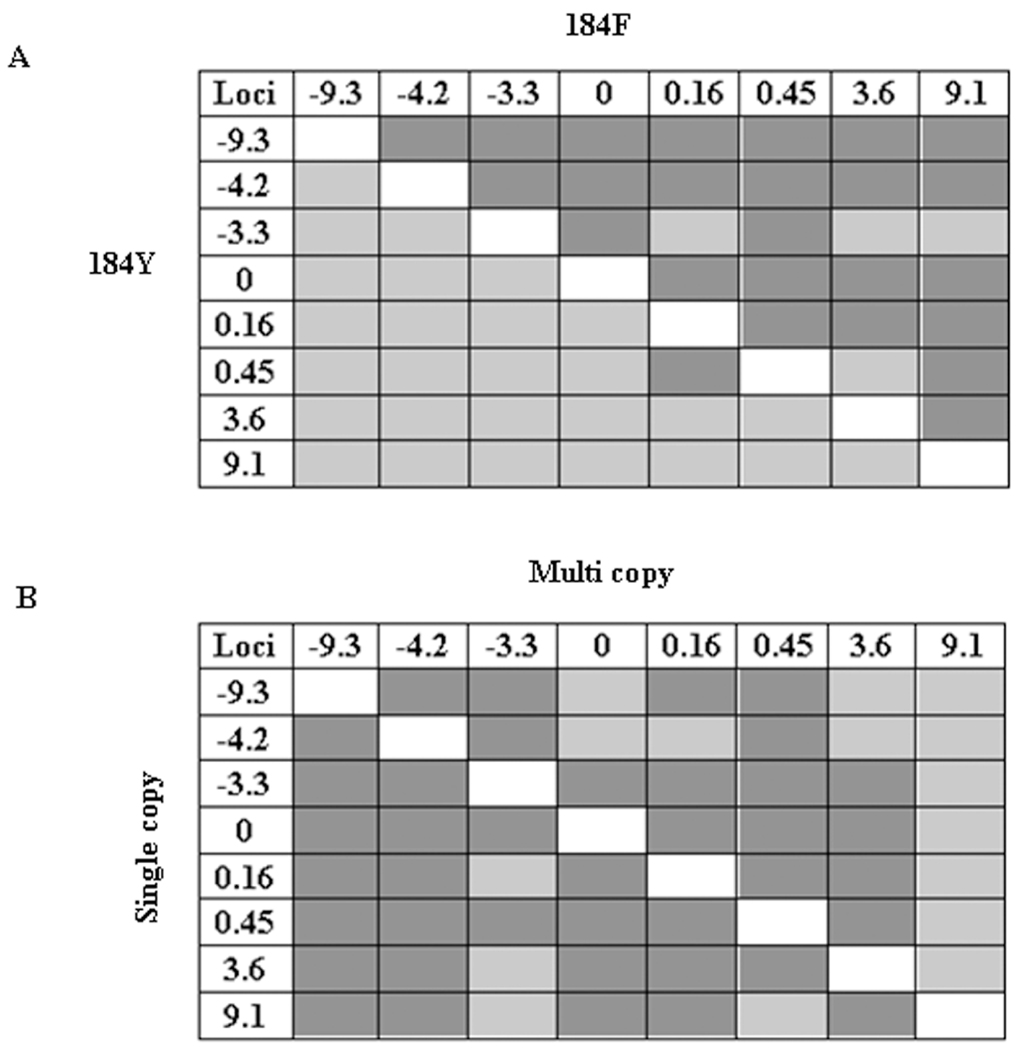
Figure 4.
Pair-wise linkage disequilibrium around pfmdr1 (± 9 kb). A, linkage disequilibrium between loci within the wild-type group (lower half of the diagonal) and mutant group (upper half of the diagonal). B, linkage disequilibrium between loci within the group of isolates with a single copy of pfmdr1 (lower half of the diagonal) and those with multiple copies of pfmdr1 (upper half of the diagonal). Each cell shows a comparison between polymorphic pairs of loci. P < .006 was considered to be significant after Bonferroni correction. Light gray cells represent P values that are not significant (>.006), and dark gray cells indicate statistically significant P values (<.006).

