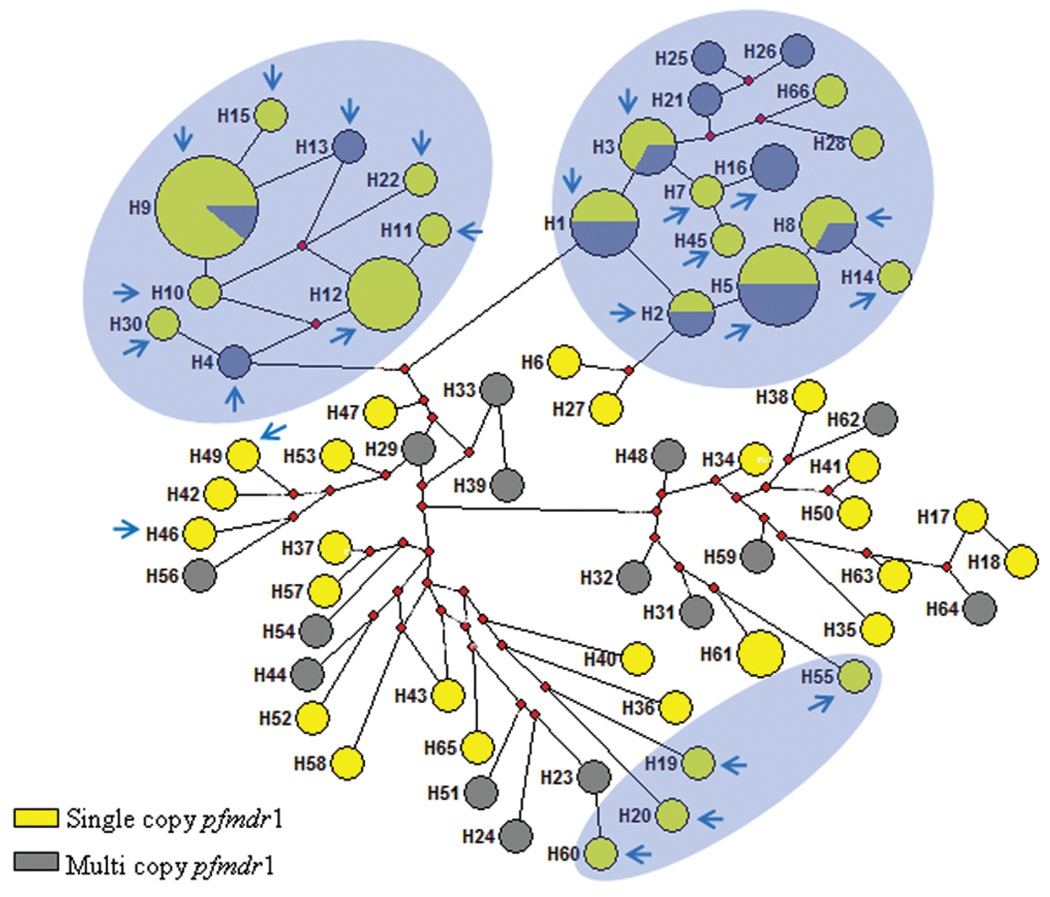
Figure 5.
Median-joining network showing genetic relationships among pfmdr1 haplotypes in Cambodia. The closest 8 loci (± 9 kb) were used for constructing the network. Each circle in this network represents a unique haplotype, with the size of the circle being proportional to the number of isolates harboring that haplotype. The circles shown in yellow and gray represent isolates carrying single and multiple copies of pfmdr1, respectively. The haplotype shared by both isolates with single and isolates with multiple pfmdr1 copies (proportion indicated in pie charts) are shown as a circle with both yellow and gray shading. The red dots are the median vectors that imply software-generated “hypothetical haplotypes,” joining 2 haplotypes in the diagram from which single and/or multiple pfmdr1 copy–containing haplotypes may have originated. The isolates with 184F are marked by blue arrows enclosed in the shaded clusters.

