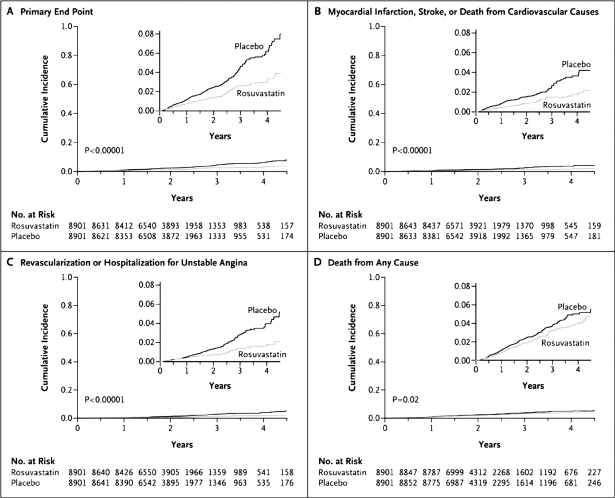
Figure 2.
Cumulative incidence of cardiovascular events according to study group. Panel A shows the cumulative incidence of the primary end point (nonfatal myocardial infarction, nonfatal stroke, arterial revascularization, hospitalization for unstable angina, or confirmed death from cardiovascular causes). The hazard ratio for rosuvastatin, as compared with placebo, was 0.56 (95% confidence interval [CI], 0.46–0.69; P < .00001). Panel B shows the cumulative incidence of nonfatal myocardial infarction, nonfatal stroke, or death from cardiovascular causes, for which the hazard ratio in the rosuvastatin group was 0.53 (95% CI, 0.40–0.69; P < .00001). Panel C shows the cumulative incidence of arterial revascularization or hospitalization for unstable angina, for which the hazard ratio in the rosuvastatin group was 0.53 (95% CI, 0.40–0.70; P < .00001). Panel D shows the cumulative incidence of death from any cause, for which the hazard ratio in the rosuvastatin group was 0.80 (95% CI, 0.67–0.97; P = .02).
(Reproduced with permission from Ridker PM, Danielson E, Fonseca FA, et al. N Engl J Med 2008; 359: 2195–2207.12)

