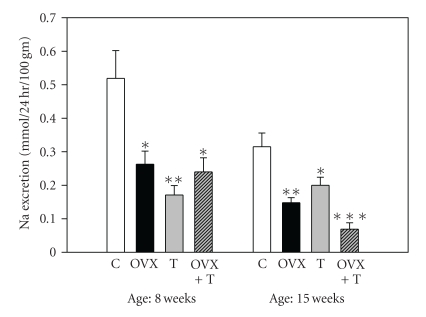
Figure 2.
Urinary sodium excretion (24 hr) by age and treatment (means ± SEM). Two-way repeated measures ANOVA: treatment-F = 9.1, df = 3, P < .001, age-F = 3.1, df = 9, P < .05, interaction not significant. Open bars: controls (C, n = 8), solid black bars: ovarectomy (OVX, n = 6), gray bars: testosterone treated (T, n = 6), striped bars: ovarectomy and testosterone treatment (OVX+T, n = 7) (*P < .05, **P < .01, ***P < .001 compared to control).

