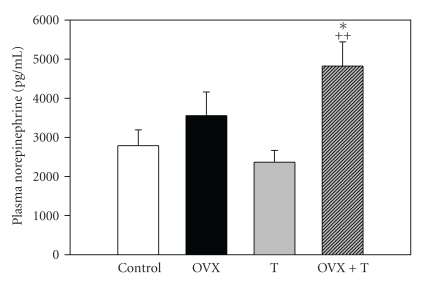
Figure 3.
Plasma norepinephrine at the end of the experiment by treatment group (means ± S.E.M.). Open bars: controls, n = 8, solid black bars: ovarectomy (OVX, n = 6), gray bars: testosterone treated (T, n = 6), striped bars: ovarectomy and testosterone treatment (OVX+T, n = 7). One-way ANOVA: H = 9.6, df = 3, P < .05, *P < .05 compared to controls, ++ P < .01 compared to testosterone treatment.

