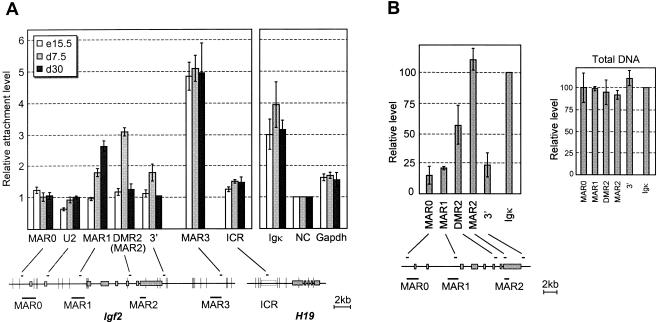
FIG. 3.
Matrix association patterns of Igf2 MARs during liver development. Below the bar graphs, the positions of restriction sites (vertical bars), real-time PCR-amplified sequences (small horizontal bars), potential MARs, and exons (solid boxes) are indicated. (A) Nuclear halos prepared from liver nuclei at the indicated developmental stages were digested with XbaI, HindIII, and BamHI. The graph shows the relative matrix attachment levels, expressed as the ratio between the amount of target sequence in the loop (S) and MAR fractions (P) after normalization to a negative control (NC), which was given the value of 1 (see Materials and Methods). In our assays, highly expressed genes such as gapdh and H19 (not shown) are weakly retained in the matrix fraction relative to the negative control. Error bars show the standard deviation for four (embryonic days 15.5 and 7.5) and two (embryonic day 30) independent experiments. In this experiment, MAR2 enrichment was investigated with the DMR2 primers located in the same restriction fragment. (B) Nuclear halos prepared from 7.5-day-old mouse liver were treated with DNase I. The left panel shows PCR quantifications on matrix-associated DNA, normalized to the Igκ MAR. A control performed on total genomic DNA is also shown (right panel). Error bars show the standard deviation for two independent experiments.

