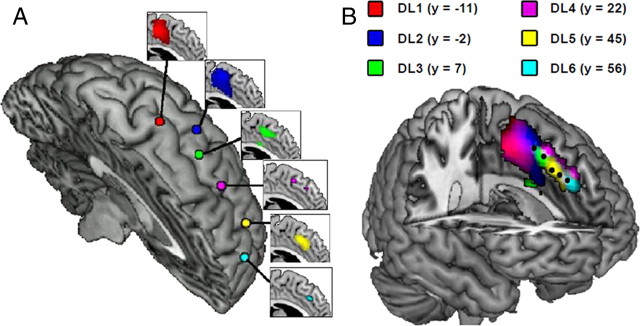
Figure 2.
The dmPFC exhibits a topographically organized connectivity pattern with functional regions in dlPFC. A, Voxel-by-voxel correlation between the preselected dmPFC regions of interest and each of the six dlPFC seed regions. For each dlPFC seed region, the correlated dmPFC voxels are shown in the connecting inset. These maps are thresholded at p < 0.1 to visualize the distribution of activation. B, Overlaying the separate connectivity maps reveals an anterior-to-posterior connectivity gradient within dmPFC. The preselected dmPFC seed regions, as used in subsequent analyses, are also highlighted in black for comparison.

