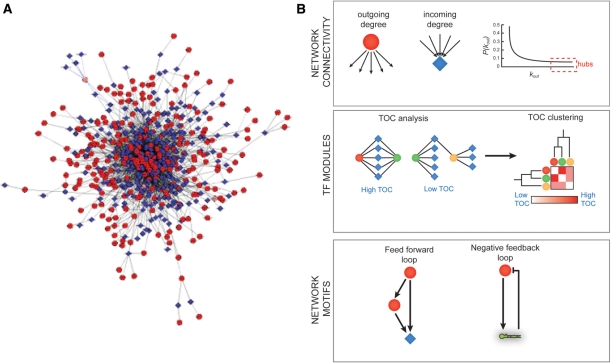
Figure 4:
GRNs can be analyzed at the whole network level, for instance by determining individual and global connectivities. (A) A compiled GRN of ∼200 C. elegans gene promoters (based on our published data). This model reflects the complexity of systems level gene regulation. Circles—TFs, diamonds, diamonds—target gene promoters, edges—protein–DNA interactions as determined by Y1H assays. This visualization was done using Cytoscape v.2.6 software with ‘random layout’ settings, which randomly distributes the nodes in a given network. (B) Top—analysis of incoming or outgoing degrees of individual nodes reveals network hubs. Middle—TOC analysis and clustering can reveal TF modules. Bottom—examples of network motifs that are overrepresented in GRNs. Circles—TFs, diamonds—target gene promoters, hairpin structure—miRNA gene promoters.

