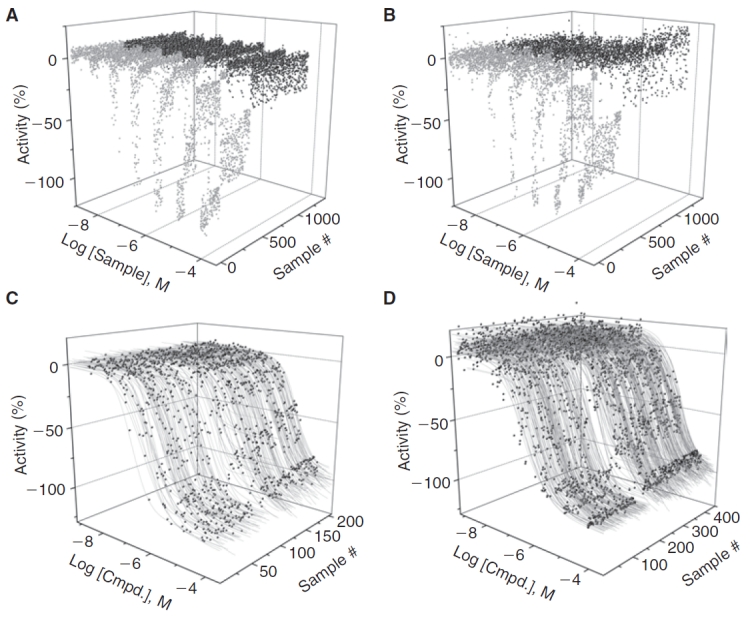
Fig. 3. .

Performance of the two 1,536-well Clk4 kinase assays. Kinase-Glo (A) and ADP-Glo (B) quantitative high-throughput screening (qHTS) experiments. Light gray represents the compounds that fit to active concentration–response curve (CRC) classes and dark gray is data classified as inactive. Data for one of the ADP-Glo qHTS experiments is shown. (C). Data and curve-fits for the highest confidence CRCs classes obtained in the Kinase-Glo qHTS. (D). Data and curve-fits for the highest confidence CRCs classes obtained in the ADP-Glo qHTS, both replicates are shown.
