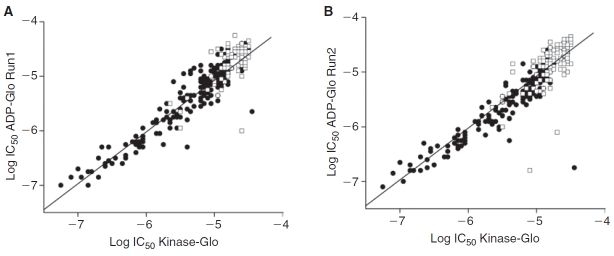
Fig. 4. .
ADP-Glo and Kinase-Glo show excellent agreement in potency values. Comparison of potency values for run 1 (A) and run 2 (B) of the ADP-Glo quantitative high-throughput screening (qHTS) against the Kinase-Glo qHTS. Black solid circles represent potencies derived from high-quality concentration–response curve (CRC) and open squares represent potencies derived from lower confidence CRCs.

