Fig. 2. .

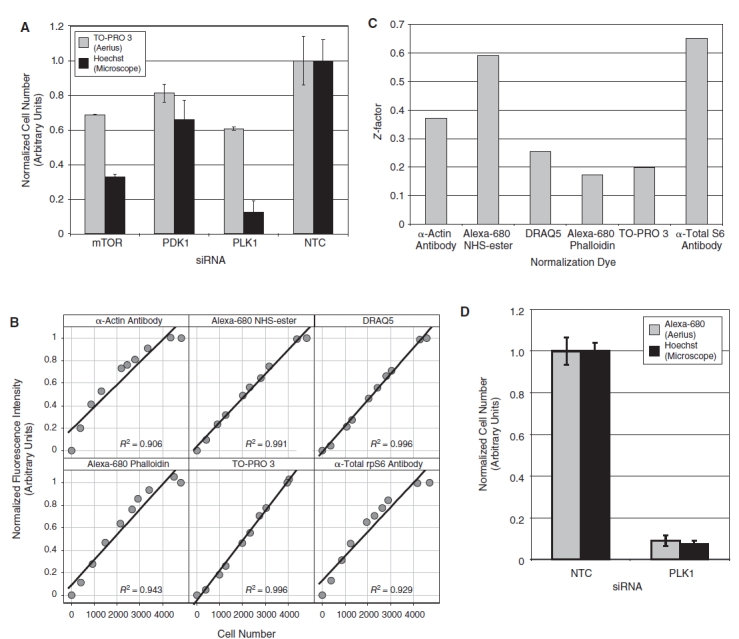
Cell number quantitation. (A) HeLa cells were transfected with the indicated siRNA, fixed, and stained with TO-PRO 3 and Hoechst. The fluorescence intensity of the TO-PRO 3 stain was measured on the 700 nm channel of the LI-COR Aerius infrared scanner (gray bars). In the same wells, Hoechst-stained nuclei were imaged on the CellWorx high-content screening microscope, and the number of cells was counted directly using the “count nuclei” module in the Metamorph image analysis software (black bars). For each staining method, the data were normalized relative to the value of the nontargeting control siRNA (n = 4, error bars show 1 standard deviation). (B) The relative fluorescence intensity of candidate cell number dyes was quantified in a 384-well format over a range of increasing cell number using the LI-COR Aerius infrared imager and plotted against cell number measured in the same samples by direct counting of Hoechst-stained nuclei as described above. Each data point represents an average of 4 replicates. Each plot is annotated with the R2 value from a linear regression of the raw data. (C) The fluorescence intensity of phospho-rpS6 staining was quantified on the 800 nm channel of the LI-COR Aerius infrared imager and normalized using the indicated counter stain as a measure of cell number. The Z′ for the normalized phospho-rpS6 stain was calculated using HeLa cells transfected with either nontargeting control siRNA or PDK1 siRNA (n = 12). The normalized phospho-rpS6 signal was used to calculate a Z′ for the assay using each of the different normalization approaches. (D) HeLa cells were transfected with either a nontargeting control siRNA or the PLK1 siRNA, fixed, and stained with Alexa-680 succinimidyl ester and Hoechst. The fluorescence intensity of the Alexa-680 succinimidyl ester stain was measured on the 700 nm channel of the LI-COR Aerius infrared scanner (gray bars). In the same wells, Hoechst-stained nuclei were imaged on the CellWorx high-content screening microscope, and the number of cells was counted directly using the “count nuclei” module in the Metamorph image analysis software (black bars). For each staining method, the data were normalized relative to the value of the nontargeting control siRNA (n = 4, error bars show 1 standard deviation).
