
Fig. 3. .
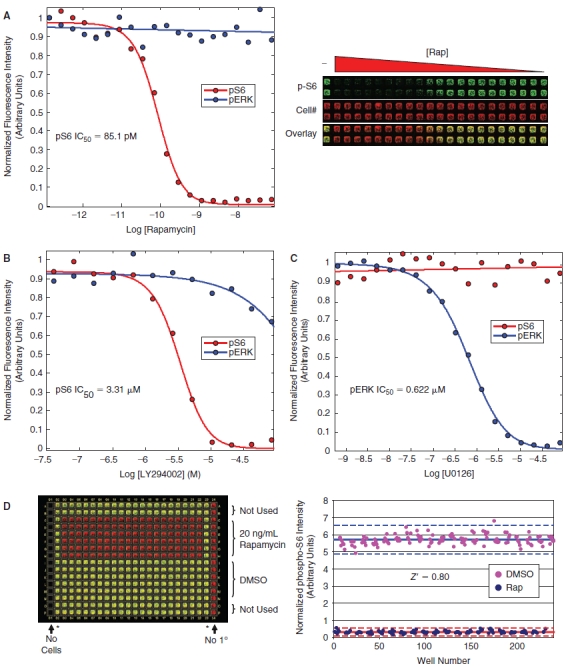
Small molecule validation data. (A) HeLa cells were treated with increasing amounts of rapamycin in a 384-well format, fixed, and stained for analysis on the LI-COR Aerius instrument using the Alexa-680 succinimidyl ester as a counter stain for cell number and the phospho-rpS6 antibody followed by an IRDye-800CW secondary antibody for quantitation of rpS6 phosphorylation. The dose-dependent inhibition of rpS6-staining was fit with a standard 4-parameter model giving an IC50 of 85.1 pM (red curve). In a parallel experiment, cells were serum-starved overnight, treated with increasing amounts of rapamycin, stimulated with EGF, fixed, and stained using the Alexa-680 succinimidyl ester and the phospho-ERK antibody followed by an IRDye-800CW secondary antibody for quantitation of ERK phosphorylation (blue curve), showing that rapamycin does not inhibit ERK phosphorylation. Each data point is an average of 4 independent experiments. The raw image from the LI-COR Aerius scanner is shown on the right. (B) A similar dose–response experiment was performed using the PI3-kinase inhibitor, LY294002, showing an IC50 of 3.31 µM for the phospho-S6 assay (red curve) (LY294002 was significantly less active toward the MAPK pathway showing an IC50 > 0.25 mM (blue curve). (C) A dose response using the MEK inhibitor, UO126, was performed showing no inhibition of rpS6-phosphorylation across a range of concentrations (red curve). In a parallel experiment, the activity of the UO126 compound was confirmed, showing a dose-dependent inhibition of ERK phosphorylation in response to EGF stimulation with an IC50 of 0.622 µM (blue curve). (D) The statistical reproducibility of the assay for small molecule screening was determined by calculating a Z′ for the assay comparing 20 ng/mL rapamycin to DMSO control in a 384-well format. The raw data for this assay is shown in the left panel, with the phospho-rpS6 signal (green) overlaid with the Alexa-680 succinimidyl ester cell number stain (red). The quantitation of the raw data is shown in the right panel and was used to calculate a Z′ of 0.80 for this experiment. The asterisks (*) denote untreated wells that were not used in the Z′ determination.