
Fig. 4. .
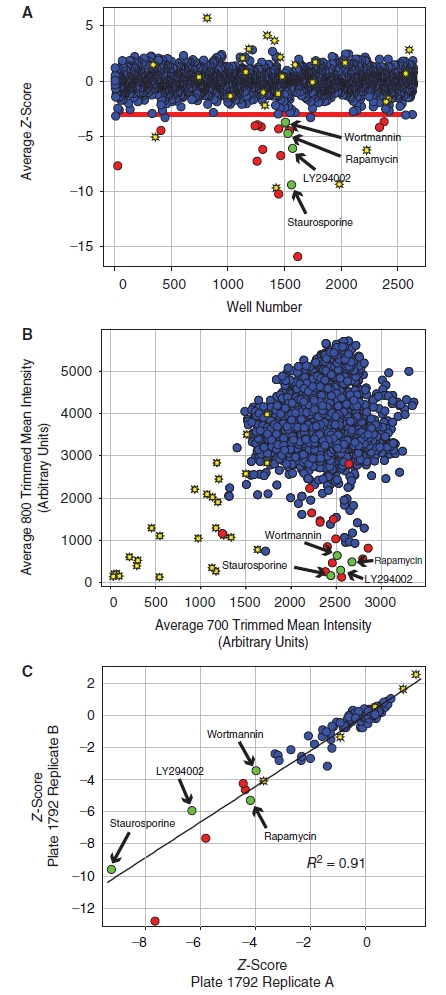
Small molecule pilot screen. (A) A library of 2,640 compounds from the ICCB-L Known Bioactives Collection was screened to identify inhibitors of rpS6-phosphorylation. The average Z-score for each compound is shown as a blue circle. The viability of cells was also measured using the Alexa-680 cell number stain, and compounds with cell numbers at least 3 standard deviations below the plate mean (Zcell# < −3) were scored as cytotoxic (yellow stars). Hits were defined as compounds that reduced normalized phospho-rpS6 staining at least 3 standard deviations below the plate mean (ZrpS6 < −3) without cytotoxicity (red circles). Known inhibitors of the pathway, including wortmannin, rapamycin, LY294002, and staurosporine, scored as hits in the screen demonstrating the validity of the approach (green circles). (B) The data from the small molecule screen is represented as a correlation plot where the x-axis shows the raw trimmed mean intensity for the Alexa-680 NHS-ester cell number staining measured on the 700 nm channel and the y-axis shows the raw trimmed mean intensity for the phospho-S6 staining measured on the 800 nm channel. The symbols are defined as in panel A. The correlation plot shows that the inhibitors identified in the screen, including the known inhibitors of mTORC1 signaling, did not generally lead to a reduction in cell number, demonstrating that the normalization strategy used for data analysis accurately corrected for changes in the phospho-S6 signal caused by changes in cell number. (C) The plate to plate reproducibility of the assay is shown for a representative plate from the screen (Plate# 1792). The Z-score for each compound on 2 independent replicate plates is shown and labeled as above. A linear fit of the data gives an R2 of 0.91, indicating good agreement between the 2 replicate plates.