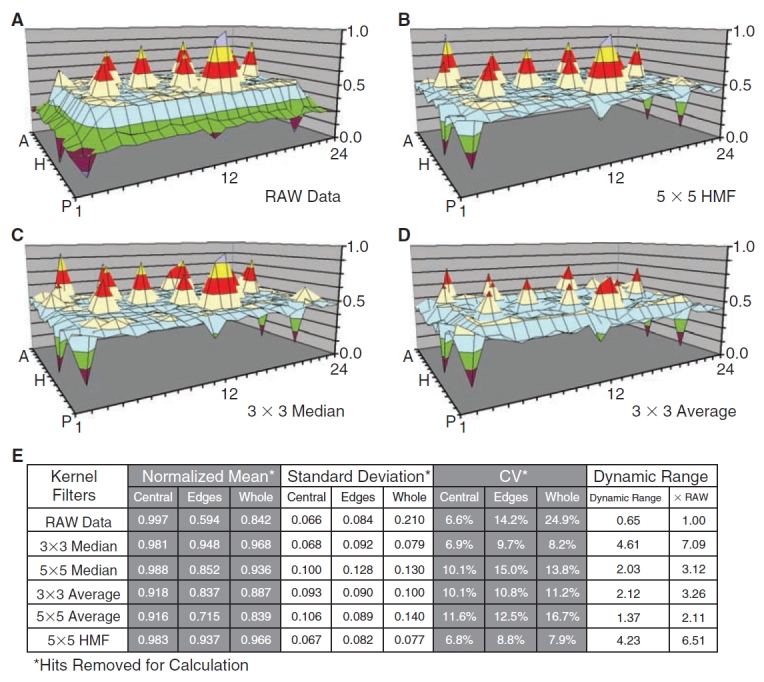
Fig. 3. .

Comparison of local background estimators. The performances of the average, median, and bidirectional hybrid median filters (HMFs) are compared using the Synthetic1 dataset. The raw data are shown in (A) and the array corrections are shown in (B) for the 5 × 5 HMF, (C) for the 3 × 3 median filter, and (D) for the average filter. A data table (E) statistically summarizes the capacity of each filter to smooth localized background distortion while preserving hit amplitudes in the Excel array. Mean, standard deviation, and coefficient of variation (CV) were calculated with the simulated hits removed. Dynamic range was calculated according to Equation 7. The table breaks down corrective performance at the edges and central region of the array. Edge regions are defined by a 2-element wide border plus 1 element nested at each corner. The 5 × 5 median and average filters are not shown in surface plots because of reduced correction efficiency and method redundancy, but are summarized in (E). The scale and color codes are identical, with each color corresponding to 12.5% of the total range.
