Fig. 5. .

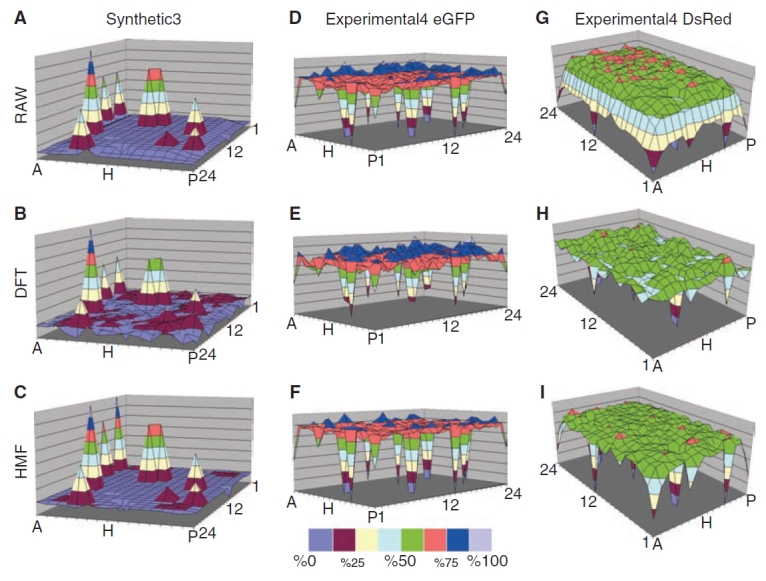
Panel of surface maps comparing corrections to arrays with nested outliers. Surface maps of the Synthetic3 dataset (A–C) and Experimental4 eGFP (D–F) and Experimental4 DsRed (G–I) are shown, as described in Methods and Table 1. The RAW data are shown in (A, D, and G) and the data as corrected by the 5 × 5 bidirectional hybrid median filter (HMF) (C, F, and I) and the Discrete Fourier Transform (DFT) (B, E, and H) methods. The Experimental4 eGFP and DsRED data are shown separately but each well contains both fluorescent proteins. The eGFP and DsRED differ in localized edge distortion prior to correction (see Discussion). Color intervals represent 12% of the RAW array range. All MTPs shown are normalized with respect to the maximum and minimum of their respective RAW dataset. The RAW datasets shown, therefore, span 0%–100%.
