Fig. 6. .

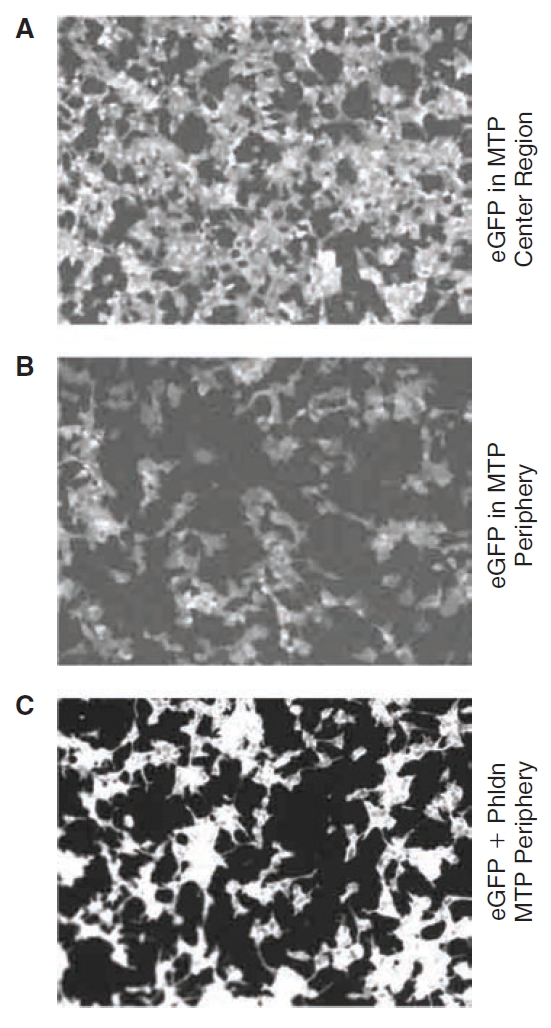
Example microtiter plate (MTP) edge distortion in the cell-based fluorescent assay. The example eGFP raw images from MTP used in the Experimental2 dataset are shown. Panel (A) from a central well is brighter than the image in (B) from a peripheral well, demonstrating an edge effect. (C) Shows an example simulated hit. Brightness was increased artificially in (A) and (B), relative to (C) for display, resulting in higher backgrounds—note the resulting higher backgrounds and lower contrast.
