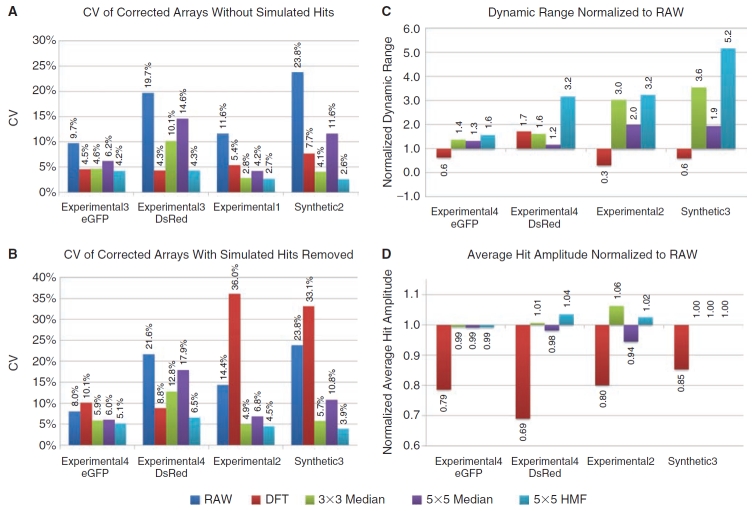
Fig. 7. .
Summary of background estimator performance. (A) The coefficient of variations (CVs) for the corrected Synthetic2, Experimental1, and the eGFP and DsRed datasets of Experimental3 that contained no simulated hits are shown. (B) The CVs of corrected Synthetic3, Experimental2, and the eGFP and DsRed datasets of Experimental4, which contained simulated hits that were removed prior to CV calculations, are shown. (C) Shows the effect of array corrections on dynamic range. The average absolute deviation of hits from the array mean is divided by the background standard deviation (values shown above dynamic range bars). The corrected arrays were then normalized to the RAW data dynamic range by division. (D) The average absolute deviations of hits from each array were normalized to the RAW data and shown as a percentage of the RAW data amplitude. Importantly, (C) shows the consolidated effect of the correction method (noise, localized distortion, and preservation of dynamic range), whereas (D) tests if dynamic range improvements were made by erosion or exaggeration of array hit amplitudes. See Methods for details on calculations.

