Figure 1.
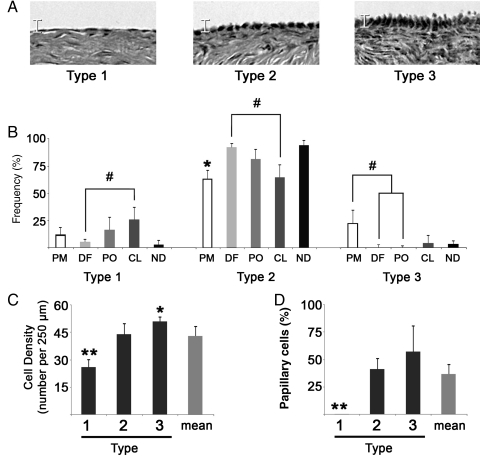
Frequency and density of OSE morphological types and cells with apical projections. (A) Images display representative examples of Type 1, 2 or 3 OSE cells. Scale bracket is 10 μm. (B) Histograms summarize the frequency of each type in relation to the stage of the natural menstrual cycle (PM, perimenstrual; DF, dominant follicle developing; PO, periovulatory; CL, corpus luteum active; ND, no dominant structure apparent). # denotes trend differences (P ≤ 0.1) between indicated groups; * denotes P < 0.01 between PM and DF. (C) Density of OSE cell Types, expressed as the number of cells per 250 μm of ovarian surface. * and ** denote P < 0.05 and P < 0.01, respectively, from Type 2. (D) Percentage of cells bearing an apical projection by type. ** denotes P < 0.01, compared with others. Error bars are the standard error of measurements from sampled FOV.

