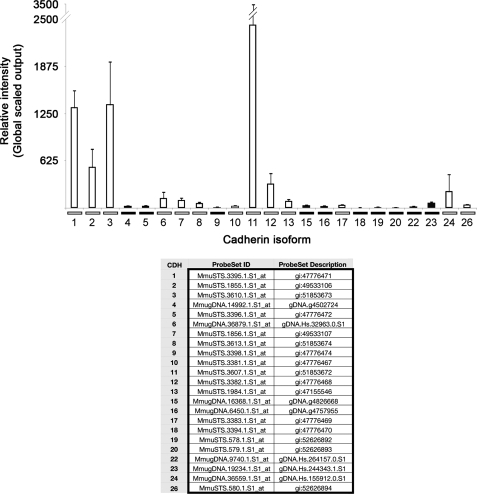
Figure 2.
Transcriptional profile of mRNA levels for different cadherin isoforms in the primate OSE in vivo. Histogram shows the mean global-scaled, RMA-normalized fluorescent signal obtained from each chip (n = 3) hybridized with labeled OSE cDNA. Error bars are the standard error of measurements from RNA samples from three monkeys. Open bars indicate transcripts defined as ‘present’ while filled bars represent ‘absent’ transcripts. Table lists each Affymetrix probe set ID and description.

