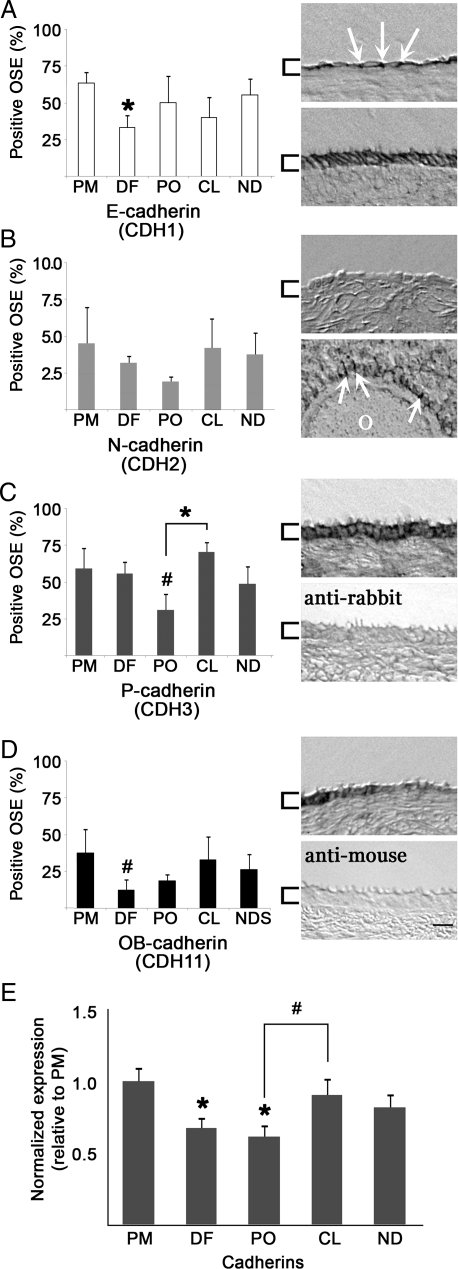
Figure 4.
Cadherin isoform expression in the OSE during the menstrual cycle. Histograms (A–D, left panels; E) show mean expression levels in the OSE during each defined stage. Data are mean ± standard error for n≥ 3 sections per ovary. Images (right panels) show labeling for each isoform antibody, or negative control, as indicated. Arrows highlight regions of cell–cell contact; brackets highlight the OSE; scale bar = 10 μm. (A) E-cadherin: upper panel presents Type 1 cells, lower panel shows Type 3 cells. (B) N-cadherin: upper panel shows OSE, lower panel demonstrates expression in granulosa cells surrounding the oocyte (O) of a pre-antral follicle. (C) P-cadherin: upper panel shows OSE cells; lower panel represents a negative control: tissue labeled only with secondary anti-rabbit antibody. (D) OB-cadherin: upper panel shows OSE; lower panel shows tissue labeled only with secondary anti-mouse antibody. (E) Pooled expression of all cadherins, normalized to PM stage values. * denotes P < 0.05 relative to PM expression, or as indicated; # denotes trending differences (P ≤ 0.1) relative to PM, or as indicated.

