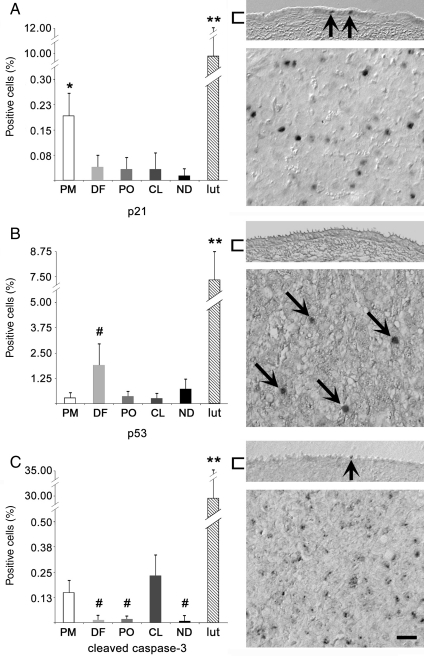
Figure 7.
Antibody labeling to detect cell cycle arrest and apoptotic potential. Percentage of positive OSE cells (left panels) labeled for (A) p21, (B) p53 and (C) cleaved caspase-3. Expression in Day 21 luteal tissue (lut; n = 3) is shown for comparison. * and ** denote P < 0.05 between OSE of other stages and P < 0.01 from OSE of all stages; # denotes trending differences (P ≤ 0.1) relative to PM (B) or PM and CL (C). Images (right panels) show the OSE (upper) or luteal tissue (lower). Brackets highlight the OSE; arrows indicate positive OSE or luteal cells; scale bar = 15 μm.

