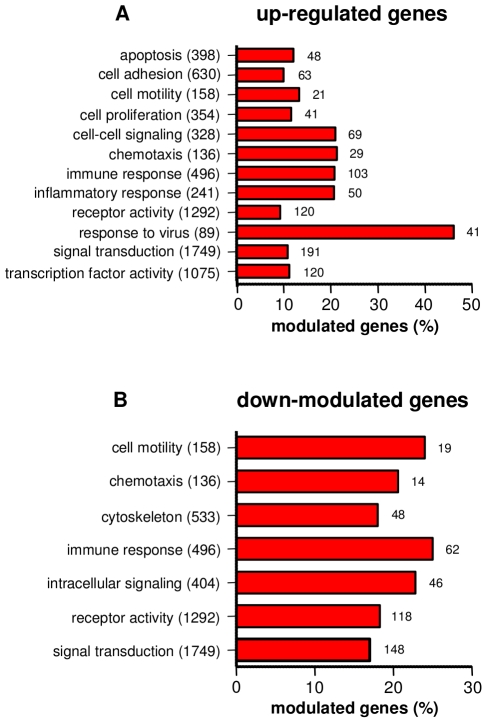
Figure 2. GO analysis of differentially expressed genes.
Monocytes were stimulated with O. tsutsugamushi or mock stimulated for 8 hours, and the modulation of genes was analyzed using microarrays and GO term tools. The upregulated (A) and downregulated (B) genes were classified based on the major biological processes in which they are involved. The total number of genes present in each biological process and the number of differentially expressed genes are indicated. The results are expressed as the percentage of the upregulated or downregulated genes.

